|
1000
|
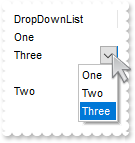
It is possible to search for an item ( inside the Editor ), case insensitive
OleObject oGrid,var_Editor,var_Items

oGrid = ole_1.Object
oGrid.BeginUpdate()
var_Editor = oGrid.Columns.Add("DropDownList").Editor
	var_Editor.EditType = 3
	var_Editor.AddItem(1,"One")
	var_Editor.AddItem(2,"Two")
	var_Editor.AddItem(3,"Three")
var_Items = oGrid.Items
	var_Items.AddItem(oGrid.Columns.Item(0).Editor.FindItem(">ONE"))
	var_Items.AddItem(oGrid.Columns.Item(0).Editor.FindItem(">ThRee"))
	var_Items.AddItem(oGrid.Columns.Item(0).Editor.FindItem("ONE"))
	var_Items.AddItem(oGrid.Columns.Item(0).Editor.FindItem(">tWo"))
oGrid.EndUpdate()
|
|
999
|
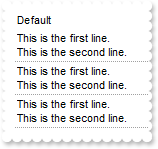
The text after the BR-tag is in same line as the text before the BR-tag (entire column)
OleObject oGrid,var_Column,var_Items

oGrid = ole_1.Object
oGrid.BeginUpdate()
oGrid.DrawGridLines = 1
var_Column = oGrid.Columns.Add("Default")
	var_Column.Def(17,1)
	var_Column.Def(16,false)
var_Items = oGrid.Items
	var_Items.AddItem("This is the first line.<br>This is the second line.")
	var_Items.AddItem("This is the first line.<br>This is the second line.")
	var_Items.AddItem("This is the first line.<br>This is the second line.")
oGrid.EndUpdate()
|
|
998
|
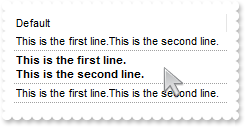
The text after the BR-tag is in same line as the text before the BR-tag (individual)
OleObject oGrid,var_Items
any h

oGrid = ole_1.Object
oGrid.BeginUpdate()
oGrid.DrawGridLines = 1
oGrid.Columns.Add("Default")
var_Items = oGrid.Items
	var_Items.CellValueFormat(var_Items.AddItem("This is the first line.<br>This is the second line."),0,1)
	h = var_Items.AddItem("<b>This is the first line.<br>This is the second line.</b>")
	var_Items.CellValueFormat(h,0,1)
	var_Items.CellSingleLine(h,0,false)
	var_Items.CellValueFormat(var_Items.AddItem("This is the first line.<br>This is the second line."),0,1)
oGrid.EndUpdate()
|
|
997
|
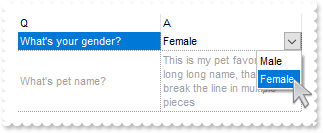
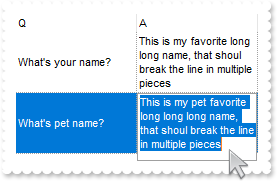
Can I disable an item once the user selects a new value into a different item
/*begin event Change(long  Item, long  ColIndex, any  NewValue) - Occurs when the user changes the cell's content.*/
/*
	OleObject var_Items
	oGrid = ole_1.Object
	var_Items = oGrid.Items
		var_Items.EnableItem(var_Items.ItemByIndex(1),false)
*/
/*end event Change*/

OleObject oGrid,var_Editor,var_Items
any h1,h2

oGrid = ole_1.Object
oGrid.FreezeEvents(true)
oGrid.BeginUpdate()
oGrid.ScrollBySingleLine = true
oGrid.DrawGridLines = -2
oGrid.Columns.Add("Q")
oGrid.Columns.Add("A")
var_Items = oGrid.Items
	h1 = var_Items.AddItem("What's your gender?")
	var_Editor = var_Items.CellEditor(h1,1)
		var_Editor.EditType = 3
		var_Editor.AddItem(1,"Male")
		var_Editor.AddItem(0,"Female")
	var_Items.CellValue(h1,1,1)
	h2 = var_Items.AddItem("What's pet name?")
	var_Items.CellValue(h2,1,"This is my pet favorite long long long name, that shoul break the line in multiple pieces")
	var_Items.CellSingleLine(h2,1,false)
oGrid.EndUpdate()
oGrid.FreezeEvents(false)
|
|
996
|
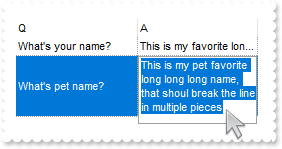
How can I get a row expanded / enlarged to fit the cell's text (entire column)
OleObject oGrid,var_Column,var_Editor,var_Items
any h1,h2

oGrid = ole_1.Object
oGrid.BeginUpdate()
oGrid.ScrollBySingleLine = true
oGrid.DrawGridLines = -2
oGrid.Columns.Add("Q")
var_Column = oGrid.Columns.Add("A")
	var_Column.Def(16,false)
	var_Editor = var_Column.Editor
		var_Editor.EditType = 5
		var_Editor.Appearance = 8
var_Items = oGrid.Items
	h1 = var_Items.AddItem("What's name?")
	var_Items.CellValue(h1,1,"This is my pet favorite long long long name, that shoul break the line in multiple pieces")
	h2 = var_Items.AddItem("What's your pet name?")
	var_Items.CellValue(h2,1,"This is my pet favorite long long long name, that shoul break the line in multiple pieces")
oGrid.EndUpdate()
|
|
995
|
How can I get a row expanded / enlarged to fit the cell's text (individual cell)
OleObject oGrid,var_Editor,var_Items
any h1,h2

oGrid = ole_1.Object
oGrid.BeginUpdate()
oGrid.ScrollBySingleLine = true
oGrid.DrawGridLines = -2
oGrid.Columns.Add("Q")
oGrid.Columns.Add("A")
var_Items = oGrid.Items
	h1 = var_Items.AddItem("What's name?")
	var_Items.CellValue(h1,1,"This is my pet favorite long long long name, that shoul break the line in multiple pieces")
	h2 = var_Items.AddItem("What's your pet name?")
	var_Editor = var_Items.CellEditor(h2,1)
		var_Editor.EditType = 5
		var_Editor.Appearance = 8
	var_Items.CellValue(h2,1,"This is my pet favorite long long long name, that shoul break the line in multiple pieces")
	var_Items.CellSingleLine(h2,1,false)
oGrid.EndUpdate()
|
|
994
|
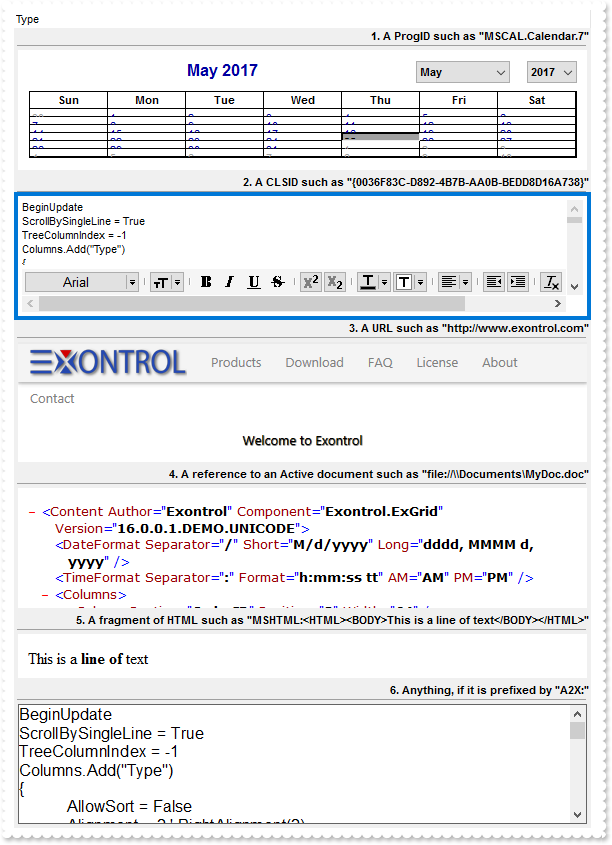
InsertControlItem / UserEditor / A2X:
OleObject oGrid,var_Items
any h,hX

oGrid = ole_1.Object
oGrid.BeginUpdate()
oGrid.BackColor = RGB(240,240,240)
oGrid.ConditionalFormats.Add("1 = 1").Bold = true
oGrid.Columns.Add("Type").Alignment = 2
var_Items = oGrid.Items
	h = var_Items.AddItem("1. A ProgID such as " + CHAR(34) + "MSCAL.Calendar.7" + CHAR(34) + "")
	var_Items.ItemDivider(h,0)
	hX = var_Items.InsertControlItem(0,"MSCAL.Calendar","")
	var_Items.ItemObject(hX).BackColor = RGB(255,255,255)
	h = var_Items.AddItem("2. A CLSID such as " + CHAR(34) + "{0036F83C-D892-4B7B-AA0B-BEDD8D16A738}" + CHAR(34) + "")
	var_Items.ItemDivider(h,0)
	hX = var_Items.InsertControlItem(0,"{0036F83C-D892-4B7B-AA0B-BEDD8D16A738}","")
	h = var_Items.AddItem("3. A URL such as " + CHAR(34) + "http://www.exontrol.com" + CHAR(34) + "")
	var_Items.ItemDivider(h,0)
	hX = var_Items.InsertControlItem(0,"http://www.exontrol.com","")
	h = var_Items.AddItem("4. A reference to an Active document such as " + CHAR(34) + "file://\\Documents\MyDoc.doc" + CHAR(34) + "")
	var_Items.ItemDivider(h,0)
	hX = var_Items.InsertControlItem(0,"file://C:\empesting.xml","")
	h = var_Items.AddItem("5.A fragment of HTML such as " + CHAR(34) + "MSHTML:<HTML><BODY>This is a line of text</BODY></HTML>" + CHAR(34) + "")
	var_Items.ItemDivider(h,0)
	hX = var_Items.InsertControlItem(0,"MSHTML:<HTML><BODY>This is a <b>line of</b> text</BODY></HTML>","")
	var_Items.ItemHeight(hX,56)
	h = var_Items.AddItem("6.Anything, if it is preffixed by " + CHAR(34) + "A2X:" + CHAR(34) + "")
	var_Items.ItemDivider(h,0)
	hX = var_Items.InsertControlItem(0,"A2X:TOC24.Toc24Ctrl.1","")
oGrid.EndUpdate()
|
|
993
|
How do I add a RichTextBox editor
/*begin event UserEditorOleEvent(oleobject  Object, oleobject  Ev, boolean  CloseEditor, long  Item, long  ColIndex) - Occurs when an user editor fires an event.*/
/*
	oGrid = ole_1.Object
	MessageBox("Information",string( String(Ev) ))
*/
/*end event UserEditorOleEvent*/

OleObject oGrid,var_Editor,var_Items,var_RichTextBox

oGrid = ole_1.Object
oGrid.BeginUpdate()
oGrid.DrawGridLines = -1
oGrid.DefaultItemHeight = 32
var_Editor = oGrid.Columns.Add("RICHTEXT").Editor
	var_Editor.EditType = 16
	var_Editor.UserEditor("RICHTEXT.RichtextCtrl","")
	var_RichTextBox = var_Editor.UserEditorObject
		var_RichTextBox.AutoVerbMenu = true
		var_RichTextBox.TextRTF = "{\rtf1\ansi{\fonttbl\f0\fswiss Helvetica;}\f0\pard\r\nThis is some {\b bold} text.\par\r\n}"
var_Items = oGrid.Items
	var_Items.AddItem("RICHTEXT.RichtextCtrl")
oGrid.EndUpdate()
|
|
992
|
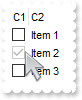
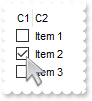
Is it possible to trap a double-click event on a specific cell and when that happens, to set the cell to a specific value
/*begin event DblClick(integer  Shift, long  X, long  Y) - Occurs when the user dblclk the left mouse button over an object.*/
/*
	any h
	oGrid = ole_1.Object
	h = oGrid.ItemFromPoint(-1,-1,c,hit)
	MessageBox("Information",string( String(oGrid.Items.CellValue(h,c)) ))
*/
/*end event DblClick*/

OleObject oGrid,var_Items

oGrid = ole_1.Object
oGrid.BeginUpdate()
oGrid.HeaderAppearance = 4
oGrid.DrawGridLines = -2
oGrid.Columns.Add("C1")
oGrid.Columns.Add("C2")
var_Items = oGrid.Items
	var_Items.CellValue(var_Items.AddItem("Item 1"),1,"Item 2")
	var_Items.CellValue(var_Items.AddItem("Item 3"),1,"Item 4")
	var_Items.CellValue(var_Items.AddItem("Item 5"),1,"Item 6")
oGrid.EndUpdate()
|
|
991
|
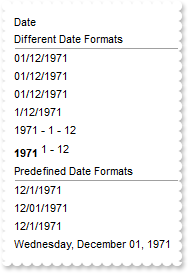
How can I display dates in DD/MM/YYYY format
OleObject oGrid,var_Items
any h

oGrid = ole_1.Object
oGrid.BeginUpdate()
oGrid.ScrollBySingleLine = false
oGrid.Columns.Add("Date")
var_Items = oGrid.Items
	var_Items.ItemDivider(var_Items.AddItem("Different Date Formats"),0)
	var_Items.FormatCell(var_Items.AddItem(1971-12-01),0,"((shortdateF(value) mid 4) left 2) + `/` + (shortdateF (value) left 2) + `/` + (shortdateF (value) right 4)")
	var_Items.FormatCell(var_Items.AddItem(1971-12-01),0,"(1 array (0:=(shortdateF(value) split `/`))) + `/` + (0 array (=:0) ) + `/` + (2 array (=:0) )")
	var_Items.FormatCell(var_Items.AddItem(1971-12-01),0,"((`0` + day(value) ) right 2) + `/` + ((`0` + month(value) ) right 2) + `/` + year(value)")
	var_Items.FormatCell(var_Items.AddItem(1971-12-01),0,"day(value) + `/` + month(value) + `/` + year(value)")
	var_Items.FormatCell(var_Items.AddItem(1971-12-01),0,"year(value) + ` - ` + day(value) + ` - ` + month(value)")
	h = var_Items.AddItem(1971-12-01)
	var_Items.ItemHeight(h,24)
	var_Items.CellValueFormat(h,0,1)
	var_Items.FormatCell(h,0,"`<b>` + year(value) + `</b><off -4> ` + day(value) + ` - ` + month(value)")
	var_Items.ItemDivider(var_Items.AddItem("Predefined Date Formats"),0)
	var_Items.FormatCell(var_Items.AddItem(1971-12-01),0,"value")
	var_Items.FormatCell(var_Items.AddItem(1971-12-01),0,"shortdateF(value)")
	var_Items.FormatCell(var_Items.AddItem(1971-12-01),0,"shortdate(value)")
	var_Items.FormatCell(var_Items.AddItem(1971-12-01),0,"longdate(value)")
oGrid.EndUpdate()
|
|
990
|
I have noticed that the column gets resized once I release the mouse. I have a column that displays multiple-lines cells, and the text gets wrapped only when user releases the mouse. Is it possible to get resized contiguously as I had before
OleObject oGrid

oGrid = ole_1.Object
oGrid.BeginUpdate()
oGrid.ScrollBySingleLine = false
oGrid.DrawGridLines = 2
oGrid.ColumnsAllowSizing = true
oGrid.Columns.Add("Column A (cont)").Def(64,true)
oGrid.Columns.Add("Column 1")
oGrid.Columns.Add("Column B (cont)").Def(64,true)
oGrid.Columns.Add("Column 2")
oGrid.EndUpdate()
|
|
989
|
How do I get the column from cursor, when it hovers the empty portion of the items section
/*begin event MouseMove(integer  Button, integer  Shift, long  X, long  Y) - Occurs when the user moves the mouse.*/
/*
	any i
	oGrid = ole_1.Object
	i = oGrid.ItemFromPoint(0,-1,c,hit)
	MessageBox("Information",string( "Column" ))
	MessageBox("Information",string( String(c) ))
*/
/*end event MouseMove*/

OleObject oGrid

oGrid = ole_1.Object
oGrid.BeginUpdate()
oGrid.DrawGridLines = 2
oGrid.Columns.Add("Column 0")
oGrid.Columns.Add("Column 1")
oGrid.Columns.Add("Column 2")
oGrid.EndUpdate()
|
|
988
|
How do I add items once the user clicks the empty area
/*begin event Click() - Occurs when the user presses and then releases the left mouse button over the grid control.*/
/*
	OleObject var_Items
	any i
	oGrid = ole_1.Object
	i = oGrid.ItemFromPoint(0,-1,c,hit)
	var_Items = oGrid.Items
		var_Items.CellValue(var_Items.AddItem(i),1,c)
*/
/*end event Click*/

OleObject oGrid

oGrid = ole_1.Object
oGrid.BeginUpdate()
oGrid.Columns.Add("Number of Items to Add")
oGrid.Columns.Add("Click on Column")
oGrid.EndUpdate()
|
|
987
|
Is there any option to stop events
/*begin event AddItem(long  Item) - Occurs after a new Item has been inserted to Items collection.*/
/*
	oGrid = ole_1.Object
	MessageBox("Information",string( "AddItem event is fired only if FreezeEvents(False) is called" ))
*/
/*end event AddItem*/

OleObject oGrid,var_Items
any h1,h2

oGrid = ole_1.Object
oGrid.FreezeEvents(true)
oGrid.BeginUpdate()
oGrid.DefaultItemHeight = 24
oGrid.Columns.Add("Task")
var_Items = oGrid.Items
	h1 = var_Items.AddItem("Task 1")
	h2 = var_Items.AddItem("Task 2")
oGrid.EndUpdate()
oGrid.FreezeEvents(false)
|
|
986
|
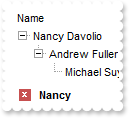
How can I include the child items, when a filter is applied
OleObject oGrid,var_Columns,var_Items
any h0

oGrid = ole_1.Object
oGrid.BeginUpdate()
oGrid.ColumnAutoResize = true
oGrid.ContinueColumnScroll = false
oGrid.MarkSearchColumn = false
oGrid.SearchColumnIndex = 1
oGrid.Indent = 16
oGrid.LinesAtRoot = -1
oGrid.FilterBarPromptVisible = 1
oGrid.FilterBarPromptPattern = "Nancy"
oGrid.FilterInclude = 1
var_Columns = oGrid.Columns
	var_Columns.Add("Name").Width = 96
	var_Columns.Add("Title").Width = 96
	var_Columns.Add("City")
var_Items = oGrid.Items
	h0 = var_Items.AddItem("Nancy Davolio")
	var_Items.CellValue(h0,1,"Sales Representative")
	var_Items.CellValue(h0,2,"Seattle")
	h0 = var_Items.InsertItem(h0,,"Andrew Fuller")
	var_Items.CellValue(h0,1,"Vice President, Sales")
	var_Items.CellValue(h0,2,"Tacoma")
	h0 = var_Items.InsertItem(h0,,"Michael Suyama")
	var_Items.CellValue(h0,1,"Sales Representative")
	var_Items.CellValue(h0,2,"London")
	h0 = var_Items.AddItem("Janet Leverling")
	var_Items.CellValue(h0,1,"Sales Representative")
	var_Items.CellValue(h0,2,"Kirkland")
	h0 = var_Items.InsertItem(h0,,"Margaret Peacock")
	var_Items.CellValue(h0,1,"Sales Representative")
	var_Items.CellValue(h0,2,"Redmond")
	var_Items.ExpandItem(0,true)
oGrid.ApplyFilter()
oGrid.EndUpdate()
|
|
985
|
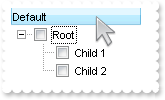
How do I prevent changing the cell's state ( check-box state )
/*begin event CellStateChanging(long  Item, long  ColIndex, long  NewState) - Fired before cell's state is about to be changed.*/
/*
	OleObject var_Items
	oGrid = ole_1.Object
	var_Items = oGrid.Items
		NewState = var_Items.CellState(Item,ColIndex)
*/
/*end event CellStateChanging*/

OleObject oGrid,var_Column,var_Column1,var_Items
any h

oGrid = ole_1.Object
oGrid.BeginUpdate()
oGrid.LinesAtRoot = -1
var_Column = oGrid.Columns.Add("P1")
	var_Column.Def(0,true)
	var_Column.PartialCheck = true
var_Column1 = oGrid.Columns.Add("P2")
	var_Column1.Def(0,true)
	var_Column1.PartialCheck = true
var_Items = oGrid.Items
	h = var_Items.AddItem("Root")
	var_Items.InsertItem(h,,"Child 1")
	var_Items.InsertItem(h,,"Child 2")
	var_Items.ExpandItem(h,true)
oGrid.EndUpdate()
|
|
984
|
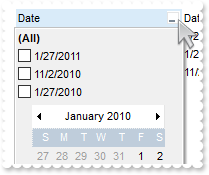
How do I get sorted the column as string, numeric, date, date and time. Also how can it be applied to drop down filter panel
OleObject oGrid,var_Column,var_Column1,var_Column2,var_Column3,var_Column4,var_Items
any h

oGrid = ole_1.Object
oGrid.BeginUpdate()
var_Column = oGrid.Columns.Add("Date")
	var_Column.SortType = 2
	var_Column.DisplayFilterButton = true
	var_Column.DisplayFilterPattern = false
	var_Column.DisplayFilterDate = true
	var_Column.FilterList = 1296 /*exShowFocusItem | exShowCheckBox | exSortItemsDesc*/
var_Column1 = oGrid.Columns.Add("DateTime")
	var_Column1.SortType = 3
	var_Column1.DisplayFilterButton = true
	var_Column1.DisplayFilterPattern = false
	var_Column1.FilterList = 1296 /*exShowFocusItem | exShowCheckBox | exSortItemsDesc*/
var_Column2 = oGrid.Columns.Add("Time")
	var_Column2.SortType = 4
	var_Column2.DisplayFilterButton = true
	var_Column2.DisplayFilterPattern = false
	var_Column2.FilterList = 1296 /*exShowFocusItem | exShowCheckBox | exSortItemsDesc*/
	var_Column2.FormatColumn = "time(value)"
var_Column3 = oGrid.Columns.Add("Numeric")
	var_Column3.SortType = 1
	var_Column3.DisplayFilterButton = true
	var_Column3.FilterList = 1296 /*exShowFocusItem | exShowCheckBox | exSortItemsDesc*/
var_Column4 = oGrid.Columns.Add("String")
	var_Column4.DisplayFilterButton = true
	var_Column4.FilterList = 1296 /*exShowFocusItem | exShowCheckBox | exSortItemsDesc*/
var_Items = oGrid.Items
	h = var_Items.AddItem(2010-01-27)
	var_Items.CellValue(h,1,DateTime(2010-01-27,10:00:00))
	var_Items.CellValue(h,2,var_Items.CellValue(h,1))
	var_Items.CellValue(h,3,1)
	var_Items.CellValue(h,4,var_Items.CellValue(h,3))
	h = var_Items.AddItem(2011-01-27)
	var_Items.CellValue(h,1,DateTime(2011-01-27,09:00:00))
	var_Items.CellValue(h,2,var_Items.CellValue(h,1))
	var_Items.CellValue(h,3,11)
	var_Items.CellValue(h,4,var_Items.CellValue(h,3))
	h = var_Items.AddItem(2010-11-02)
	var_Items.CellValue(h,1,DateTime(2010-11-02,09:00:00))
	var_Items.CellValue(h,2,var_Items.CellValue(h,1))
	var_Items.CellValue(h,3,2)
	var_Items.CellValue(h,4,var_Items.CellValue(h,3))
oGrid.Columns.Item("DateTime").DisplayFilterDate = false
oGrid.EndUpdate()
|
|
983
|
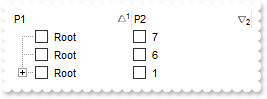
I am using Layout property to sort multiple columns at once. The problem is that all items get expanded. How do I prevent that
OleObject oGrid,var_Column,var_Column1,var_Items
any h

oGrid = ole_1.Object
oGrid.BeginUpdate()
oGrid.LinesAtRoot = -1
var_Column = oGrid.Columns.Add("P1")
	var_Column.Def(0,true)
	var_Column.PartialCheck = true
var_Column1 = oGrid.Columns.Add("P2")
	var_Column1.Def(0,true)
	var_Column1.PartialCheck = true
	var_Column1.FormatColumn = "1 index ``"
var_Items = oGrid.Items
	h = var_Items.AddItem("Root")
	var_Items.InsertItem(h,,"Child A")
	var_Items.InsertItem(h,,"Child B")
	var_Items.InsertItem(h,,"Child A")
	var_Items.InsertItem(h,,"Child B")
	var_Items.AddItem("Root")
	var_Items.AddItem("Root")
oGrid.SingleSort = false
oGrid.Layout = "multiplesort=" + CHAR(34) + "C0:1 C1:2" + CHAR(34) + ";collapse=" + CHAR(34) + "" + CHAR(34) + ""
oGrid.EndUpdate()
|
|
982
|
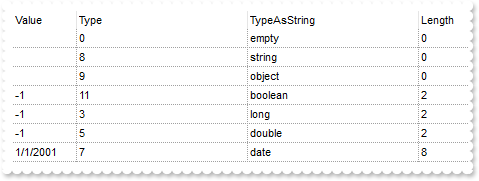
How do I find the cell's type, or what the cell holds
OleObject oGrid,var_Columns,var_Items

oGrid = ole_1.Object
oGrid.BeginUpdate()
oGrid.DrawGridLines = -2
var_Columns = oGrid.Columns
	var_Columns.Add("Value").Width = 24
	var_Columns.Add("Type").FormatColumn = "type(%0)"
	var_Columns.Add("TypeAsString").FormatColumn = "(0 := type(%0)) array (`empty`, `null`, `short`, `long`, `float`, `double`, `currency`, `date`, `string`, `object`, `error`, `boolean`, `variant`, `any`, `reserved`, `decimal`, `char`, `byte`, `unsigned short`, `unsigned long`, `long on 64 bits`)"
	var_Columns.Add("Length").FormatColumn = "len(%0)"
var_Items = oGrid.Items
	var_Items.AddItem()
	var_Items.AddItem("")
	var_Items.CellValue(.AddItem(),0,oGrid)
	var_Items.CellValue(var_Items.AddItem(),0,true)
	var_Items.CellValue(var_Items.AddItem(),0,-1)
	var_Items.CellValue(var_Items.AddItem(),0,-1)
	var_Items.CellValue(var_Items.AddItem(),0,2001-01-01)
oGrid.EndUpdate()
|
|
981
|
How can I get ride / hide the image being dragged by OLE Drag and Drop
/*begin event OLEStartDrag(oleobject  Data, long  AllowedEffects) - Occurs when the OLEDrag method is called.*/
/*
	Data.SetData("data to drag")
	oGrid = ole_1.Object
	AllowedEffects = 1
*/
/*end event OLEStartDrag*/

OleObject oGrid,var_Items
any h

oGrid = ole_1.Object
oGrid.OLEDropMode = 1
oGrid.Background(34,RGB(255,255,255))
oGrid.LinesAtRoot = -1
oGrid.Columns.Add("Default")
var_Items = oGrid.Items
	h = var_Items.AddItem("Root")
	var_Items.InsertItem(h,,"Child 1")
	var_Items.InsertItem(h,,"Child 2")
	var_Items.ExpandItem(h,true)
|
|
980
|
The ReadOnly property does not prevent changing the column's check-box (sample 2)
OleObject oGrid,var_Column,var_Items

oGrid = ole_1.Object
oGrid.BeginUpdate()
oGrid.ShowFocusRect = false
var_Column = oGrid.Columns.Add("C1")
	var_Column.AllowSizing = false
	var_Column.Width = 18
	var_Column.Editor.EditType = 19
oGrid.Columns.Add("C2")
var_Items = oGrid.Items
	var_Items.CellValue(var_Items.AddItem(0),1,"Item 1")
	var_Items.CellValue(var_Items.AddItem(-1),1,"Item 2")
	var_Items.CellValue(var_Items.AddItem(0),1,"Item 3")
oGrid.ReadOnly = true
oGrid.Columns.Item(0).Editor.Option(17,2)
oGrid.EndUpdate()
|
|
979
|
The ReadOnly property does not prevent changing the column's check-box (sample 1)
OleObject oGrid,var_Column,var_Editor,var_Items

oGrid = ole_1.Object
oGrid.BeginUpdate()
oGrid.ShowFocusRect = false
var_Column = oGrid.Columns.Add("C1")
	var_Column.AllowSizing = false
	var_Column.Width = 18
	var_Editor = var_Column.Editor
		var_Editor.EditType = 19
		var_Editor.Option(17,1)
oGrid.Columns.Add("C2")
var_Items = oGrid.Items
	var_Items.CellValue(var_Items.AddItem(0),1,"Item 1")
	var_Items.CellValue(var_Items.AddItem(-1),1,"Item 2")
	var_Items.CellValue(var_Items.AddItem(0),1,"Item 3")
oGrid.ReadOnly = true
oGrid.EndUpdate()
|
|
978
|
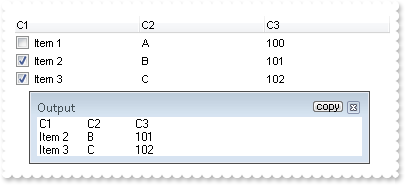
How can I export checked items only
OleObject oGrid,var_Columns,var_Items

oGrid = ole_1.Object
oGrid.BeginUpdate()
var_Columns = oGrid.Columns
	var_Columns.Add("C1").Def(0,true)
	var_Columns.Add("C2").FormatColumn = "1 index `A-Z`"
	var_Columns.Add("C3").FormatColumn = "100 index ``"
var_Items = oGrid.Items
	var_Items.AddItem("Item 1")
	var_Items.CellState(var_Items.AddItem("Item 2"),1)
	var_Items.CellState(var_Items.AddItem("Item 3"),1)
oGrid.EndUpdate()
MessageBox("Information",string( "Export CSV Checked Items Only:" ))
MessageBox("Information",string( String(oGrid.Export("","chk")) ))
|
|
977
|
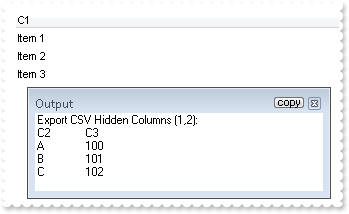
How can I export a hidden column
OleObject oGrid,var_Column,var_Column1,var_Columns,var_Items

oGrid = ole_1.Object
oGrid.BeginUpdate()
var_Columns = oGrid.Columns
	var_Columns.Add("C1")
	var_Column = var_Columns.Add("C2")
		var_Column.FormatColumn = "1 index `A-Z`"
		var_Column.Visible = false
	var_Column1 = var_Columns.Add("C3")
		var_Column1.FormatColumn = "100 index ``"
		var_Column1.Visible = false
var_Items = oGrid.Items
	var_Items.AddItem("Item 1")
	var_Items.AddItem("Item 2")
	var_Items.AddItem("Item 3")
oGrid.EndUpdate()
MessageBox("Information",string( "Export CSV Hidden Columns (1,2):" ))
MessageBox("Information",string( String(oGrid.Export("","|1,2")) ))
|
|
976
|
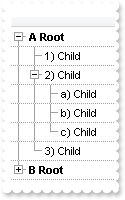
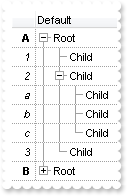
I'm trying to use automatic numbering of the outline. How can I have A, B, C for root items, 1, 2, 3 for the sub-items, and a, b, c for sub-sub-items (sample 3)
OleObject oGrid,var_Column,var_Columns,var_Items
any h,hChild

oGrid = ole_1.Object
oGrid.BeginUpdate()
oGrid.LinesAtRoot = -1
oGrid.DrawGridLines = -2
oGrid.AutoDrag = 3
oGrid.HasLines = 1
oGrid.Indent = 16
oGrid.MarkSearchColumn = false
var_Columns = oGrid.Columns
	var_Column = var_Columns.Add("")
		var_Column.Def(17,1)
		var_Column.FormatColumn = "((1:=(0 :=(1 rpos '.|A-Z||a-z|')) rfind `.`) < 0 ? `<b>` + =:0 + `` :  (=:0 mid (1 + 1 + =:1) )  + `)` ) + ` ` + value"
var_Items = oGrid.Items
	h = var_Items.AddItem("Root")
	var_Items.InsertItem(h,,"Child")
	hChild = var_Items.InsertItem(h,,"Child")
	var_Items.InsertItem(hChild,,"Child")
	var_Items.InsertItem(hChild,,"Child")
	var_Items.InsertItem(hChild,,"Child")
	var_Items.InsertItem(h,,"Child")
	var_Items.ExpandItem(0,true)
	h = var_Items.AddItem("Root")
	var_Items.InsertItem(h,,"Child")
	hChild = var_Items.InsertItem(h,,"Child")
	var_Items.CellState(hChild,0,1)
	var_Items.InsertItem(hChild,,"Child")
	var_Items.InsertItem(hChild,,"Child")
	var_Items.InsertItem(hChild,,"Child")
	var_Items.InsertItem(h,,"Child")
oGrid.EndUpdate()
|
|
975
|
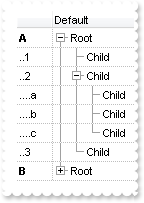
I'm trying to use automatic numbering of the outline. How can I have A, B, C for root items, 1, 2, 3 for the sub-items, and a, b, c for sub-sub-items (sample 2)
OleObject oGrid,var_Column,var_Columns,var_Items
any h,hChild

oGrid = ole_1.Object
oGrid.BeginUpdate()
oGrid.LinesAtRoot = -1
oGrid.GridLineColor = RGB(190,190,190)
oGrid.DrawGridLines = -2
oGrid.AutoDrag = 3
oGrid.HasLines = 1
oGrid.Indent = 16
var_Columns = oGrid.Columns
	var_Columns.Add("Default")
	var_Column = var_Columns.Add("")
		var_Column.Def(17,1)
		var_Column.Def(49,4)
		var_Column.AllowSizing = false
		var_Column.Width = 36
		var_Column.Position = 0
		var_Column.FormatColumn = "(1:=(0 :=(1 rpos '.|A-Z||a-z|')) rfind `.`) < 0 ? `<b>` + =:0 : (`............` left 2 * (=:0 count `.`)) + (=:0 mid (1 + 1 + =:1) ) "
var_Items = oGrid.Items
	h = var_Items.AddItem("Root")
	var_Items.InsertItem(h,,"Child")
	hChild = var_Items.InsertItem(h,,"Child")
	var_Items.InsertItem(hChild,,"Child")
	var_Items.InsertItem(hChild,,"Child")
	var_Items.InsertItem(hChild,,"Child")
	var_Items.InsertItem(h,,"Child")
	var_Items.ExpandItem(0,true)
	h = var_Items.AddItem("Root")
	var_Items.InsertItem(h,,"Child")
	hChild = var_Items.InsertItem(h,,"Child")
	var_Items.CellState(hChild,0,1)
	var_Items.InsertItem(hChild,,"Child")
	var_Items.InsertItem(hChild,,"Child")
	var_Items.InsertItem(hChild,,"Child")
	var_Items.InsertItem(h,,"Child")
oGrid.EndUpdate()
|
|
974
|
I'm trying to use automatic numbering of the outline. How can I have A, B, C for root items, 1, 2, 3 for the sub-items, and a, b, c for sub-sub-items (sample 1)
OleObject oGrid,var_Column,var_Columns,var_Items
any h,hChild

oGrid = ole_1.Object
oGrid.BeginUpdate()
oGrid.LinesAtRoot = -1
oGrid.DrawGridLines = -2
oGrid.AutoDrag = 3
oGrid.HasLines = 1
oGrid.Indent = 16
var_Columns = oGrid.Columns
	var_Columns.Add("Default")
	var_Column = var_Columns.Add("")
		var_Column.Def(17,1)
		var_Column.Def(49,4)
		var_Column.Alignment = 2
		var_Column.AllowSizing = false
		var_Column.Width = 24
		var_Column.Position = 0
		var_Column.FormatColumn = "(1:=(0 :=(1 rpos '.|A-Z||a-z|')) rfind `.`) < 0 ? `<b>` + =:0 : `<i>` + (=:0 mid (1 + 1 + =:1) ) "
var_Items = oGrid.Items
	h = var_Items.AddItem("Root")
	var_Items.InsertItem(h,,"Child")
	hChild = var_Items.InsertItem(h,,"Child")
	var_Items.InsertItem(hChild,,"Child")
	var_Items.InsertItem(hChild,,"Child")
	var_Items.InsertItem(hChild,,"Child")
	var_Items.InsertItem(h,,"Child")
	var_Items.ExpandItem(0,true)
	h = var_Items.AddItem("Root")
	var_Items.InsertItem(h,,"Child")
	hChild = var_Items.InsertItem(h,,"Child")
	var_Items.CellState(hChild,0,1)
	var_Items.InsertItem(hChild,,"Child")
	var_Items.InsertItem(hChild,,"Child")
	var_Items.InsertItem(hChild,,"Child")
	var_Items.InsertItem(h,,"Child")
oGrid.EndUpdate()
|
|
973
|
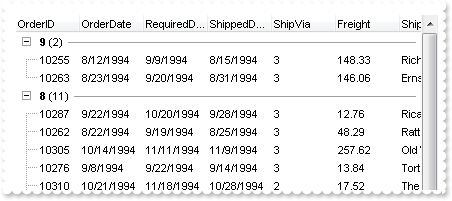
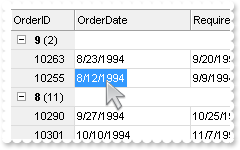
How can I programmatically group by columns, without having the control's sort bar visible
OleObject oGrid,rs

oGrid = ole_1.Object
oGrid.BeginUpdate()
oGrid.ColumnAutoResize = false
rs = CREATE OLEObject
rs.ConnectToNewObject("ADOR.Recordset")
	rs.Open("Orders","Provider=Microsoft.ACE.OLEDB.12.0;Data Source=C:\Program Files\Exontrol\ExGrid\Sample\Access\misc.accdb",3,3)
oGrid.DataSource = rs
oGrid.SortBarHeight = 0
oGrid.SortBarVisible = true
oGrid.SortBarCaption = "Drag a <b>column</b> header here to group by that column."
oGrid.AllowGroupBy = true
oGrid.Layout = "multiplesort=" + CHAR(34) + "C1:2" + CHAR(34) + ""
oGrid.EndUpdate()
|
|
972
|
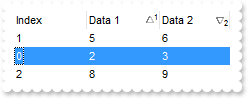
How do I perform my own sort
/*begin event Sort() - Fired when the control sorts a column.*/
/*
	OleObject var_Items
	oGrid = ole_1.Object
	MessageBox("Information",string( "Sort" ))
	var_Items = oGrid.Items
		var_Items.ItemPosition(var_Items.ItemByIndex(1),0)
		var_Items.ItemPosition(var_Items.ItemByIndex(0),1)
*/
/*end event Sort*/

OleObject oGrid,var_Columns,var_Items
any h

oGrid = ole_1.Object
oGrid.BeginUpdate()
oGrid.SingleSort = false
oGrid.SortOnClick = 1
var_Columns = oGrid.Columns
	var_Columns.Add("Index").FormatColumn = "0 index ``"
	var_Columns.Add("Data 1")
	var_Columns.Add("Data 2")
var_Items = oGrid.Items
	h = var_Items.AddItem(0)
	var_Items.CellValue(h,1,2)
	var_Items.CellValue(h,2,3)
	h = var_Items.AddItem(4)
	var_Items.CellValue(h,1,5)
	var_Items.CellValue(h,2,6)
	h = var_Items.AddItem(7)
	var_Items.CellValue(h,1,8)
	var_Items.CellValue(h,2,9)
oGrid.Layout = "multiplesort=" + CHAR(34) + "C1:1 C2:2" + CHAR(34) + ""
oGrid.EndUpdate()
|
|
971
|
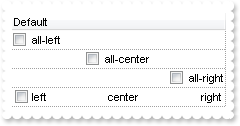
Is it possible to have a different alignment for parts of the cell's caption
OleObject oGrid,var_Column,var_Items
any h

oGrid = ole_1.Object
oGrid.BeginUpdate()
oGrid.TreeColumnIndex = -1
oGrid.DrawGridLines = -2
var_Column = oGrid.Columns.Add("Default")
	var_Column.Def(0,true)
var_Items = oGrid.Items
	var_Items.CellHAlignment(var_Items.AddItem("all-left"),0,0)
	var_Items.CellHAlignment(var_Items.AddItem("all-center"),0,1)
	var_Items.CellHAlignment(var_Items.AddItem("all-right"),0,2)
	h = var_Items.AddItem("left<c>center<r>right")
	var_Items.CellValueFormat(h,0,1)
oGrid.EndUpdate()
|
|
970
|
I have a column with Def(exCellSingleLine) property on False, word-wrapping, and I am wondering if possible to update the column's content while user is resizing it
OleObject oGrid,var_Column,var_Column1,var_Columns,var_Items

oGrid = ole_1.Object
oGrid.BeginUpdate()
var_Columns = oGrid.Columns
	var_Column = var_Columns.Add("MultipleLine")
		var_Column.Width = 32
		var_Column.Def(16,false)
		var_Column.Def(64,true)
	var_Column1 = var_Columns.Add("SingleLine")
		var_Column1.Def(16,false)
var_Items = oGrid.Items
	var_Items.CellValue(var_Items.AddItem("This is a bit of long text that should break the line"),1,"This is a bit of long text that should break the line")
oGrid.EndUpdate()
|
|
969
|
How can I get the absolute position of an item
/*begin event MouseMove(integer  Button, integer  Shift, long  X, long  Y) - Occurs when the user moves the mouse.*/
/*
	OleObject var_Items
	oGrid = ole_1.Object
	var_Items = oGrid.Items
		MessageBox("Information",string( var_Items.CellCaption(oGrid.ItemFromPoint(-1,-1,c,hit),"Position") ))
*/
/*end event MouseMove*/

OleObject oGrid,var_Column,var_Items
any h

oGrid = ole_1.Object
oGrid.BeginUpdate()
oGrid.BackColorAlternate = RGB(240,240,240)
oGrid.LinesAtRoot = -1
oGrid.Columns.Add("Def").DisplayFilterButton = true
var_Items = oGrid.Items
	h = var_Items.AddItem("Root")
	var_Items.InsertItem(var_Items.InsertItem(h,,"Child 1"),,"Sub-Child 1")
	var_Items.InsertItem(var_Items.InsertItem(h,,"Child 2"),,"Sub-Child 2")
oGrid.PutItems(oGrid.GetItems(-1))
oGrid.PutItems(oGrid.GetItems(-1))
oGrid.PutItems(oGrid.GetItems(-1))
var_Column = oGrid.Columns.Add("Position")
	var_Column.FormatColumn = "1 apos ``"
	var_Column.Visible = false
oGrid.EndUpdate()
|
|
968
|
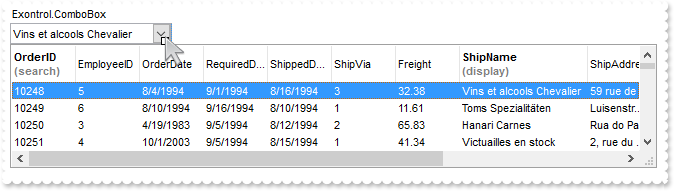
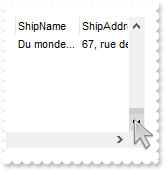
I am using ExComboBox as an user editor, how can I display a different column
/*begin event UserEditorClose(oleobject  Object, long  Item, long  ColIndex) - Fired the user editor is about to be opened.*/
/*
	Items.CellValue(Item,ColIndex) = Object.Value
	oGrid = ole_1.Object
*/
/*end event UserEditorClose*/

/*begin event UserEditorOleEvent(oleobject  Object, oleobject  Ev, boolean  CloseEditor, long  Item, long  ColIndex) - Occurs when an user editor fires an event.*/
/*
	oGrid = ole_1.Object
	MessageBox("Information",string( String(Ev) ))
*/
/*end event UserEditorOleEvent*/

/*begin event UserEditorOpen(oleobject  Object, long  Item, long  ColIndex) - Occurs when an user editor is about to be opened.*/
/*
	Object.Value = Me.Items.CellValue(Item,ColIndex)
	oGrid = ole_1.Object
*/
/*end event UserEditorOpen*/

OleObject oGrid,rs,var_Column,var_Column1,var_ComboBox,var_Editor,var_Items

oGrid = ole_1.Object
oGrid.BeginUpdate()
var_Editor = oGrid.Columns.Add("Exontrol.ComboBox").Editor
	var_Editor.EditType = 16
	var_Editor.UserEditor("Exontrol.ComboBox","")
	var_ComboBox = var_Editor.UserEditorObject
		var_ComboBox.BeginUpdate()
		var_ComboBox.Style = 2
		var_ComboBox.ColumnAutoResize = false
		rs = CREATE OLEObject
rs.ConnectToNewObject("ADOR.Recordset")
			rs.Open("Orders","Provider=Microsoft.ACE.OLEDB.12.0;Data Source=C:\Program Files\Exontrol\ExGrid\Sample\Access\misc.accdb",3,3)
		var_ComboBox.DataSource = rs
		var_ComboBox.Alignment = 0
		var_ComboBox.IntegralHeight = true
		var_ComboBox.MinHeightList = 128
		var_ComboBox.MinWidthList = 648
		var_ComboBox.HeaderHeight = 36
		var_ComboBox.AllowSizeGrip = true
		var_ComboBox.SingleEdit = true
		var_ComboBox.LabelColumnIndex = 7
		var_ComboBox.SearchColumnIndex = 0
		var_Column = var_ComboBox.Columns.Item(0)
			var_Column.HeaderBold = true
			var_Column.HTMLCaption = "OrderID<br><fgcolor=808080>(search)"
		var_Column1 = var_ComboBox.Columns.Item(7)
			var_Column1.HeaderBold = true
			var_Column1.HTMLCaption = "ShipName<br><fgcolor=808080>(display)"
			var_Column1.Width = 128
		var_ComboBox.UseTabKey = false
		var_ComboBox.EndUpdate()
oGrid.DrawGridLines = -2
oGrid.DefaultItemHeight = 21
var_Items = oGrid.Items
	var_Items.CellEditorVisible(var_Items.AddItem(10248),0,1)
	var_Items.CellEditorVisible(var_Items.AddItem(10249),0,1)
	var_Items.CellEditorVisible(var_Items.AddItem(10250),0,1)
oGrid.EndUpdate()
|
|
967
|
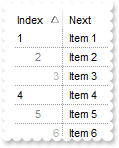
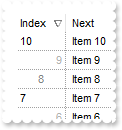
How do I sort the index column as numeric (Method 3)
/*begin event AddItem(long  Item) - Occurs after a new Item has been inserted to Items collection.*/
/*
	OleObject var_Items
	oGrid = ole_1.Object
	var_Items = oGrid.Items
		var_Items.CellData(Item,1,var_Items.CellCaption(Item,1))
*/
/*end event AddItem*/

OleObject oGrid,var_Column,var_Column1,var_Items

oGrid = ole_1.Object
oGrid.BeginUpdate()
oGrid.DrawGridLines = -1
oGrid.ColumnAutoResize = true
oGrid.ShowFocusRect = false
var_Column = oGrid.Columns.Add("Next")
	var_Column.Def(48,4)
	var_Column.Def(52,4)
var_Column1 = oGrid.Columns.Add("Index")
	var_Column1.AllowSizing = false
	var_Column1.Width = 48
	var_Column1.FormatColumn = "(((0 := (1 index ``)) mod 3) case ( default: ``; 0 : `<r><fgcolor=B0B0B0>`; 1: ``; 2 : `<c><fgcolor=808080>` )) + str(=:0)"
	var_Column1.Def(17,1)
	var_Column1.SortType = 5
	var_Column1.Position = 0
var_Items = oGrid.Items
	var_Items.AddItem("Item 1")
	var_Items.AddItem("Item 2")
	var_Items.AddItem("Item 3")
	var_Items.AddItem("Item 4")
	var_Items.AddItem("Item 5")
	var_Items.AddItem("Item 6")
	var_Items.AddItem("Item 7")
	var_Items.AddItem("Item 8")
	var_Items.AddItem("Item 9")
	var_Items.AddItem("Item 10")
oGrid.EndUpdate()
|
|
966
|
How do I sort the index column as numeric (Method 2)
/*begin event AddItem(long  Item) - Occurs after a new Item has been inserted to Items collection.*/
/*
	OleObject var_Items
	oGrid = ole_1.Object
	var_Items = oGrid.Items
		var_Items.CellSortData(Item,1,var_Items.CellCaption(Item,1))
*/
/*end event AddItem*/

OleObject oGrid,var_Column,var_Column1,var_Items

oGrid = ole_1.Object
oGrid.BeginUpdate()
oGrid.DrawGridLines = -1
oGrid.ColumnAutoResize = true
oGrid.ShowFocusRect = false
var_Column = oGrid.Columns.Add("Next")
	var_Column.Def(48,4)
	var_Column.Def(52,4)
var_Column1 = oGrid.Columns.Add("Index")
	var_Column1.AllowSizing = false
	var_Column1.Width = 48
	var_Column1.FormatColumn = "(((0 := (1 index ``)) mod 3) case ( default: ``; 0 : `<r><fgcolor=B0B0B0>`; 1: ``; 2 : `<c><fgcolor=808080>` )) + str(=:0)"
	var_Column1.Def(17,1)
	var_Column1.SortType = 6
	var_Column1.Position = 0
var_Items = oGrid.Items
	var_Items.AddItem("Item 1")
	var_Items.AddItem("Item 2")
	var_Items.AddItem("Item 3")
	var_Items.AddItem("Item 4")
	var_Items.AddItem("Item 5")
	var_Items.AddItem("Item 6")
	var_Items.AddItem("Item 7")
	var_Items.AddItem("Item 8")
	var_Items.AddItem("Item 9")
	var_Items.AddItem("Item 10")
oGrid.EndUpdate()
|
|
965
|
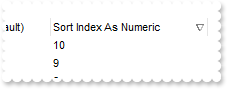
How do I sort the index column as numeric (Method 1)
OleObject oGrid,var_Column,var_Column1,var_Items

oGrid = ole_1.Object
oGrid.BeginUpdate()
var_Column = oGrid.Columns.Add("Sort Index As String (Default)")
	var_Column.FormatColumn = "1 index ``"
var_Column1 = oGrid.Columns.Add("Sort Index As Numeric")
	var_Column1.ComputedField = "%C0"
	var_Column1.SortType = 1
var_Items = oGrid.Items
	var_Items.AddItem("")
	var_Items.AddItem("")
	var_Items.AddItem("")
	var_Items.AddItem("")
	var_Items.AddItem("")
	var_Items.AddItem("")
	var_Items.AddItem("")
	var_Items.AddItem("")
	var_Items.AddItem("")
	var_Items.AddItem("")
oGrid.EndUpdate()
|
|
964
|
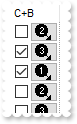
How can I put icons/images into buttons
OleObject oGrid,var_Column,var_Items

oGrid = ole_1.Object
oGrid.BeginUpdate()
oGrid.ColumnAutoResize = true
oGrid.Images("gBJJgBAIDAAGAAEAAQhYAf8Pf4hh0QihCJo2AEZjQAjEZFEaIEaEEaAIAkcbk0olUrlktl0vmExmUzmk1m03nE5nU7nk9n0/oFBoVDolFo1HpFJpVLplNp1PqFRqVTqlVq1XrFZrVbrldr1fsFhsVjslls1ntFptVrtltt1vuFxuVzul1u13vF5vV7vl9v1/wGBwWDwmFw2HxGJxWLxmNx0xiFdyOTh8Tf9ZymXx+QytcyNgz8r0OblWjyWds+m0ka1Vf1ta1+r1mos2xrG2xeZ0+a0W0qOx3GO4NV3WeyvD2XJ5XL5nN51aiw+lfSj0gkUkAEllHanHI5j/cHg8EZf7w8vl8j4f/qfEZeB09/vjLAB30+kZQAP/P5/H6/yNAOAEAwCjMBwFAEDwJBMDwLBYAP2/8Hv8/gAGAD8LQs9w/nhDY/oygIA=")
var_Column = oGrid.Columns.Add("C+B")
	var_Column.AllowSizing = false
	var_Column.Width = 48
	var_Column.FormatColumn = "` <img>` + ( 1 + (1 index ``) mod 3 ) + `</img> `"
	var_Column.Def(17,1)
	var_Column.Def(0,true)
	var_Column.Def(2,true)
	var_Column.Def(3,true)
oGrid.Columns.Add("")
oGrid.DrawGridLines = 2
oGrid.DefaultItemHeight = 20
var_Items = oGrid.Items
	var_Items.AddItem("")
	var_Items.AddItem("")
	var_Items.AddItem("")
	var_Items.AddItem("")
	var_Items.AddItem("")
	var_Items.AddItem("")
	var_Items.AddItem("")
	var_Items.AddItem("")
oGrid.EndUpdate()
|
|
963
|
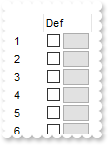
Is it possible to have a CheckBox and Button TOGETHER on all cells in a column
/*begin event ButtonClick(long  Item, long  ColIndex, any  Key) - Occurs when user clicks on the cell's button.*/
/*
	oGrid = ole_1.Object
	MessageBox("Information",string( "ButtonClick" ))
	MessageBox("Information",string( String(Item) ))
	MessageBox("Information",string( String(Key) ))
*/
/*end event ButtonClick*/

/*begin event CellStateChanged(long  Item, long  ColIndex) - Fired after cell's state has been changed.*/
/*
	oGrid = ole_1.Object
	MessageBox("Information",string( "CellStateChanged" ))
	MessageBox("Information",string( String(Item) ))
*/
/*end event CellStateChanged*/

OleObject oGrid,var_Column,var_Column1,var_Items

oGrid = ole_1.Object
oGrid.BeginUpdate()
oGrid.ColumnAutoResize = true
var_Column = oGrid.Columns.Add("")
	var_Column.AllowSizing = false
	var_Column.Width = 32
	var_Column.FormatColumn = "1 index ``"
var_Column1 = oGrid.Columns.Add("Def")
	var_Column1.AllowSizing = false
	var_Column1.Width = 48
	var_Column1.FormatColumn = "`     `"
	var_Column1.Def(0,true)
	var_Column1.Def(2,true)
	var_Column1.Def(3,true)
oGrid.Columns.Add("")
var_Items = oGrid.Items
	var_Items.AddItem("")
	var_Items.AddItem("")
	var_Items.AddItem("")
	var_Items.AddItem("")
	var_Items.AddItem("")
	var_Items.AddItem("")
	var_Items.AddItem("")
	var_Items.AddItem("")
oGrid.EndUpdate()
|
|
962
|
I have columns that look up the same data. (e.g. different contact) so both could / should use the same editor. Is this possible, to use other column's editor
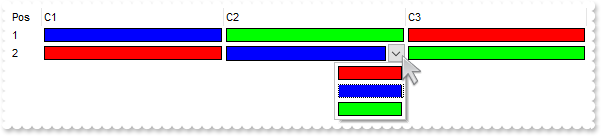
OleObject oGrid,var_Column,var_Columns,var_Editor,var_Items
any h

oGrid = ole_1.Object
oGrid.BeginUpdate()
oGrid.SelBackColor = oGrid.BackColor
oGrid.SelForeColor = oGrid.ForeColor
var_Columns = oGrid.Columns
	var_Column = var_Columns.Add("Pos")
		var_Column.Width = 32
		var_Column.AllowSizing = false
		var_Column.FormatColumn = "1 index ``"
	var_Editor = var_Columns.Add("C1").Editor
		var_Editor.EditType = 17
		var_Editor.ClearItems()
		var_Editor.AddItem(255,"Red Color")
		var_Editor.AddItem(16711680,"Blue Color")
		var_Editor.AddItem(65280,"Green Color")
	var_Columns.Add("C2").Editor.EditType = 268435457 /*CloneType | EditType*/
	var_Columns.Add("C3").Editor.EditType = 268435457 /*CloneType | EditType*/
var_Items = oGrid.Items
	h = var_Items.AddItem("")
	var_Items.CellValue(h,1,16711680)
	var_Items.CellValue(h,2,65280)
	var_Items.CellValue(h,3,255)
	h = var_Items.AddItem("")
	var_Items.CellValue(h,1,255)
	var_Items.CellValue(h,2,16711680)
	var_Items.CellValue(h,3,65280)
oGrid.EndUpdate()
|
|
961
|
Is there an easy way to get an effect like in a Microsoft Access / SQL-Server Table view, where you can scroll-up till the last row containing data is displayed as top-row
OleObject oGrid,rs

oGrid = ole_1.Object
oGrid.BeginUpdate()
oGrid.HasLines = 0
oGrid.ColumnAutoResize = false
rs = CREATE OLEObject
rs.ConnectToNewObject("ADOR.Recordset")
	rs.Open("Orders","Provider=Microsoft.ACE.OLEDB.12.0;Data Source=C:\Program Files\Exontrol\ExGrid\Sample\Access\misc.accdb",3,3)
oGrid.DataSource = rs
oGrid.ScrollBars = 2051 /*exVScrollEmptySpace | exBoth*/
oGrid.ScrollPos(true,oGrid.Items.ItemCount)
oGrid.EndUpdate()
|
|
960
|
Does filtering work with umlauts / accents characters
OleObject oGrid,var_Column,var_Items

oGrid = ole_1.Object
oGrid.BeginUpdate()
var_Column = oGrid.Columns.Add("Names")
	var_Column.DisplayFilterButton = true
	var_Column.FilterType = 3
var_Items = oGrid.Items
	var_Items.AddItem("Mantel")
	var_Items.AddItem("Mechanik")
	var_Items.AddItem("Motor")
	var_Items.AddItem("Murks")
	var_Items.AddItem("Märchen")
	var_Items.AddItem("Möhren")
	var_Items.AddItem("Mühle")
	var_Items.AddItem("Sérigraphie")
oGrid.Columns.Item(0).Filter = "*ä*"
oGrid.ApplyFilter()
oGrid.EndUpdate()
|
|
959
|
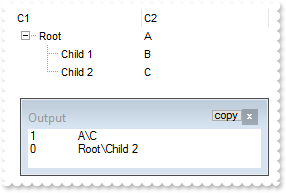
How FullPath method works
OleObject oGrid,var_Items
any h

oGrid = ole_1.Object
oGrid.BeginUpdate()
oGrid.LinesAtRoot = -1
oGrid.Columns.Add("C1")
oGrid.Columns.Add("C2")
var_Items = oGrid.Items
	h = var_Items.AddItem("Root")
	var_Items.CellValue(h,1,"A")
	var_Items.CellValue(var_Items.InsertItem(h,,"Child 1"),1,"B")
	var_Items.CellValue(var_Items.InsertItem(h,,"Child 2"),1,"C")
	var_Items.ExpandItem(h,true)
oGrid.SearchColumnIndex = 1
MessageBox("Information",string( String(oGrid.SearchColumnIndex) ))
MessageBox("Information",string( .FullPath(oGrid.Items.ItemByIndex(2)) ))
oGrid.SearchColumnIndex = 0
MessageBox("Information",string( String(oGrid.SearchColumnIndex) ))
MessageBox("Information",string( .FullPath(oGrid.Items.ItemByIndex(2)) ))
oGrid.EndUpdate()
|
|
958
|
Can I set the search box / filterbarprompt to invisible, so I can use my own input and *string* via VBA
OleObject oGrid,var_Columns,var_Items
any h0

oGrid = ole_1.Object
oGrid.BeginUpdate()
oGrid.ColumnAutoResize = true
oGrid.ContinueColumnScroll = false
oGrid.MarkSearchColumn = false
oGrid.SearchColumnIndex = 1
oGrid.FilterBarHeight = 0
oGrid.FilterBarPromptVisible = 1
var_Columns = oGrid.Columns
	var_Columns.Add("Name").Width = 96
	var_Columns.Add("Title").Width = 96
	var_Columns.Add("City")
var_Items = oGrid.Items
	h0 = var_Items.AddItem("Nancy Davolio")
	var_Items.CellValue(h0,1,"Sales Representative")
	var_Items.CellValue(h0,2,"Seattle")
	h0 = var_Items.AddItem("Andrew Fuller")
	var_Items.CellValue(h0,1,"Vice President, Sales")
	var_Items.CellValue(h0,2,"Tacoma")
	var_Items.SelectItem(h0,true)
	h0 = var_Items.AddItem("Janet Leverling")
	var_Items.CellValue(h0,1,"Sales Representative")
	var_Items.CellValue(h0,2,"Kirkland")
	h0 = var_Items.AddItem("Margaret Peacock")
	var_Items.CellValue(h0,1,"Sales Representative")
	var_Items.CellValue(h0,2,"Redmond")
	h0 = var_Items.AddItem("Steven Buchanan")
	var_Items.CellValue(h0,1,"Sales Manager")
	var_Items.CellValue(h0,2,"London")
	h0 = var_Items.AddItem("Michael Suyama")
	var_Items.CellValue(h0,1,"Sales Representative")
	var_Items.CellValue(h0,2,"London")
	h0 = var_Items.AddItem("Robert King")
	var_Items.CellValue(h0,1,"Sales Representative")
	var_Items.CellValue(h0,2,"London")
	h0 = var_Items.AddItem("Laura Callahan")
	var_Items.CellValue(h0,1,"Inside Sales Coordinator")
	var_Items.CellValue(h0,2,"Seattle")
	h0 = var_Items.AddItem("Anne Dodsworth")
	var_Items.CellValue(h0,1,"Sales Representative")
	var_Items.CellValue(h0,2,"London")
oGrid.FilterBarPromptPattern = "London"
oGrid.EndUpdate()
|
|
957
|
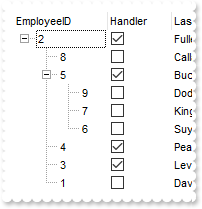
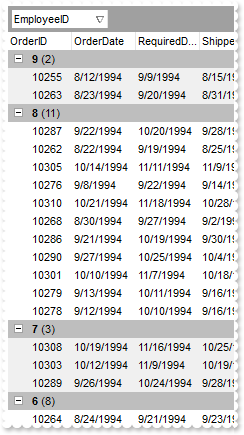
How to load a hierarchy using the control's DataSource property (Parent-ID-Relation)
/*begin event AddItem(long  Item) - Occurs after a new Item has been inserted to Items collection.*/
/*
	OleObject var_Items
	oGrid = ole_1.Object
	var_Items = oGrid.Items
		var_Items.SetParent(Item,var_Items.FindItem(var_Items.CellValue(Item,"ReportsTo"),"EmployeeID"))
*/
/*end event AddItem*/

OleObject oGrid,rs

oGrid = ole_1.Object
oGrid.BeginUpdate()
oGrid.LinesAtRoot = -1
oGrid.ColumnAutoResize = false
oGrid.ContinueColumnScroll = false
rs = CREATE OLEObject
rs.ConnectToNewObject("ADOR.Recordset")
	rs.Open("SELECT * FROM Employees ORDER BY ReportsTo","Provider=Microsoft.ACE.OLEDB.12.0;Data Source=C:\Program Files\Exontrol\ExGrid\Sample\Access\misc.accdb",3,3)
oGrid.DataSource = rs
oGrid.Items.ExpandItem(0,true)
oGrid.EndUpdate()
|
|
956
|
Is it possible to select the entire row/line, when user clicks the first column, and select individually the rest of cells, while user clicks any other column
/*begin event MouseDown(integer  Button, integer  Shift, long  X, long  Y) - Occurs when the user presses a mouse button.*/
/*
	any i
	oGrid = ole_1.Object
	i = oGrid.ItemFromPoint(-1,-1,c,hit)
	oGrid.FullRowSelect = oGrid.Columns.Item(c).Data
*/
/*end event MouseDown*/

OleObject oGrid,rs

oGrid = ole_1.Object
oGrid.BeginUpdate()
oGrid.HeaderHeight = 22
oGrid.HeaderAppearance = 1
oGrid.BackColorLock = RGB(240,240,240)
oGrid.BackColorHeader = oGrid.BackColorLock
oGrid.HasLines = 0
oGrid.ColumnAutoResize = false
oGrid.SortBarVisible = false
oGrid.AllowGroupBy = true
oGrid.ReadOnly = -1
oGrid.ShowFocusRect = false
oGrid.CountLockedColumns = 1
oGrid.AutoDrag = 16
oGrid.SingleSort = false
oGrid.ColumnsAllowSizing = true
oGrid.DrawGridLines = -1
oGrid.GridLineStyle = 48
oGrid.GridLineColor = RGB(220,220,220)
rs = CREATE OLEObject
rs.ConnectToNewObject("ADOR.Recordset")
	rs.Open("Orders","Provider=Microsoft.ACE.OLEDB.12.0;Data Source=C:\Program Files\Exontrol\ExGrid\Sample\Access\misc.accdb",3,3)
oGrid.DataSource = rs
oGrid.Columns.Item(0).Data = -1
oGrid.Layout = "singlesort=" + CHAR(34) + "C5:1" + CHAR(34) + ";multiplesort=" + CHAR(34) + " C1:2" + CHAR(34) + ""
oGrid.EndUpdate()
|
|
955
|
The user are not able to size the columns at runtime when using HeaderAppearance property on zero
OleObject oGrid

oGrid = ole_1.Object
oGrid.VisualAppearance.Add(1,"gBFLBCJwBAEHhEJAAEhABJEIQAAYAQGKIYBkAKBQAGaAoDDcMQ5QwAAyDGKEEwsACEIrjKCRShyCYZRhGcTSBCIZBqEqSZLiEZRQiiCYsS5GQBSFDcOwHGyQZonKK3LhGCYBgIA=")
oGrid.HeaderAppearance = 16777216 /*0x1000000 | */
oGrid.Columns.Add(String(1))
oGrid.Columns.Add(String(2))
oGrid.Columns.Add(String(3))
|
|
954
|
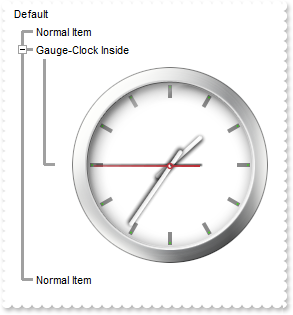
Is it possible to embed the exGauge into the exGrid control
/*begin event ItemOleEvent(long  Item, oleobject  Ev) - Fired when an ActiveX control hosted by an item has fired an event.*/
/*
	OleObject var_Gauge
	any v
	oGrid = ole_1.Object
	var_Gauge = oGrid.Items.ItemObject(oGrid.Items.ItemByIndex(2))
		v = var_Gauge.FormatABC("date(`now`)")
		var_Gauge.Layers.Item("sec").Value = v
		var_Gauge.Layers.Item("min").Value = v
		var_Gauge.Layers.Item("hour").Value = v
*/
/*end event ItemOleEvent*/

/*begin event MouseMove(integer  Button, integer  Shift, long  X, long  Y) - Occurs when the user moves the mouse.*/
/*
	OleObject var_Gauge
	oGrid = ole_1.Object
	var_Gauge = oGrid.Items.ItemObject(oGrid.Items.ItemByIndex(2))
		var_Gauge.TimerInterval = 1000
*/
/*end event MouseMove*/

OleObject oGrid,var_Gauge,var_Items,var_Layer,var_Layer1,var_Layer2,var_Layer3
any h,v

oGrid = ole_1.Object
oGrid.BeginUpdate()
oGrid.ScrollBySingleLine = true
oGrid.LinesAtRoot = -1
oGrid.HasLines = 2
oGrid.ScrollBySingleLine = true
oGrid.Columns.Add("Default")
var_Items = oGrid.Items
	h = var_Items.AddItem("Normal Item")
	h = var_Items.AddItem("Gauge-Clock Inside")
	var_Items.ExpandItem(h,true)
	h = var_Items.InsertControlItem(h,"Exontrol.Gauge")
	var_Items.ItemHeight(h,256)
	var_Gauge = var_Items.ItemObject(h)
		var_Gauge.PicturesPath = "C:\Program Files\Exontrol\ExGauge\Sample\Design\Circular\Clock"
		var_Gauge.DefaultLayer(185,2)
		var_Gauge.Layers.Count = 4
		var_Layer = var_Gauge.Layers.Item(0)
			var_Layer.Background.Picture.Name = "vista_clock.png"
		var_Layer1 = var_Gauge.Layers.Item(1)
			var_Layer1.Position = 3
			var_Layer1.Key = "sec"
			var_Layer1.OnDrag = 2
			var_Layer1.Selectable = false
			var_Layer1.Background.Picture.Name = "second-hand.png"
			var_Layer1.ValueToRotateAngle = "((2:=(((1:=( ( (0:=(value < 0 ? floor(value) + 1 - value : value - floor(value))) < 0.5 ? =:0 : (0:= (=:0 - 0.5)) ) * 24 ))  - floor(=:1)) * 60 )) - floor(=:2) ) * 360"
			var_Layer1.RotateAngleToValue = "value / 360 / 24 / 60"
		var_Layer2 = var_Gauge.Layers.Item(2)
			var_Layer2.Position = 2
			var_Layer2.Key = "min"
			var_Layer2.OnDrag = 2
			var_Layer2.Selectable = false
			var_Layer2.Background.Picture.Name = "Minute.png"
			var_Layer2.ValueToRotateAngle = "((1:=( ( (0:=(value < 0 ? floor(value) + 1 - value : value - floor(value))) < 0.5 ? =:0 : (0:= (=:0 - 0.5)) ) * 24 ))  - floor(=:1)) * 360"
			var_Layer2.RotateAngleToValue = "value / 360 / 24 / 60"
		var_Layer3 = var_Gauge.Layers.Item(3)
			var_Layer3.Position = 1
			var_Layer3.Key = "hour"
			var_Layer3.OnDrag = 2
			var_Layer3.Background.Picture.Name = "Hour.png"
			var_Layer3.ValueToRotateAngle = "2 * 360 * ( (0:=(value < 0 ? floor(value) + 1 - value : value - floor(value))) < 0.5 ? =:0 : (0:= (=:0 - 0.5)) )"
			var_Layer3.RotateAngleToValue = "value / 360 * 0.5"
		v = var_Gauge.FormatABC("date(`now`)")
		var_Gauge.Layers.Item("sec").Value = v
		var_Gauge.Layers.Item("min").Value = v
		var_Gauge.Layers.Item("hour").Value = v
	h = var_Items.AddItem("Normal Item")
oGrid.EndUpdate()
|
|
953
|
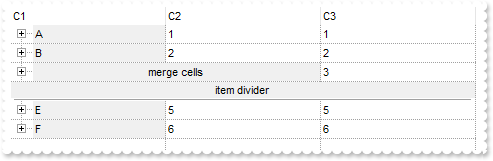
What's the difference between merge cells and divider item
/*begin event AddItem(long  Item) - Occurs after a new Item has been inserted to Items collection.*/
/*
	OleObject var_Items
	oGrid = ole_1.Object
	var_Items = oGrid.Items
		var_Items.CellBackColor(Item,0,RGB(240,240,240))
		var_Items.ItemHasChildren(Item,true)
*/
/*end event AddItem*/

OleObject oGrid,var_Items
any h

oGrid = ole_1.Object
oGrid.BeginUpdate()
oGrid.TreeColumnIndex = 0
oGrid.LinesAtRoot = -1
oGrid.DrawGridLines = -1
oGrid.Columns.Add("C1").FormatColumn = "1 index `A-Z`"
oGrid.Columns.Add("C2").FormatColumn = "1 index ``"
oGrid.Columns.Add("C3").FormatColumn = "1 index ``"
var_Items = oGrid.Items
	var_Items.AddItem()
	var_Items.AddItem()
	h = var_Items.AddItem()
	var_Items.CellMerge(h,0,1)
	var_Items.FormatCell(h,0,"`merge cells`")
	var_Items.CellHAlignment(h,0,1)
	h = var_Items.AddItem()
	var_Items.ItemDivider(h,0)
	var_Items.CellHAlignment(h,0,1)
	var_Items.FormatCell(h,0,"`item divider`")
	var_Items.AddItem()
	var_Items.AddItem()
oGrid.EndUpdate()
|
|
952
|
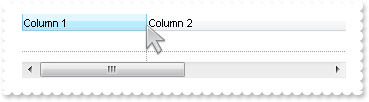
is it possible to resize a column with the mouse without changing the width of the next column
OleObject oGrid

oGrid = ole_1.Object
oGrid.BeginUpdate()
oGrid.ColumnAutoResize = false
oGrid.Columns.Add("Column 1").Width = 256
oGrid.Columns.Add("Column 2").Width = 512
oGrid.DrawGridLines = -1
oGrid.EndUpdate()
|
|
951
|
How do I ensure that the newly item fits the control's client area
/*begin event ButtonClick(long Item, long ColIndex, any Key) - Occurs when user clicks on the cell's button.*/
/*
OleObject var_Items
any h
oGrid = ole_1.Object
var_Items = oGrid.Items
h = var_Items.AddItem("")
var_Items.SelectItem(h,true)
var_Items.EnsureVisibleItem(h)
oGrid.FocusColumnIndex = 0
*/
/*end event ButtonClick*/
OleObject oGrid,var_Column,var_Items
oGrid = ole_1.Object
oGrid.BeginUpdate()
var_Column = oGrid.Columns.Add("")
var_Column.AllowSizing = false
var_Column.AllowDragging = false
var_Column.AllowSort = false
var_Column.Width = 24
var_Column.Def(2,true)
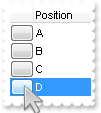
oGrid.Columns.Add("Position").FormatColumn = "1 apos `A-Z`"
oGrid.CountLockedColumns = 1
var_Items = oGrid.Items
var_Items.AddItem("")
var_Items.AddItem("")
var_Items.AddItem("")
oGrid.EndUpdate()
|
|
950
|
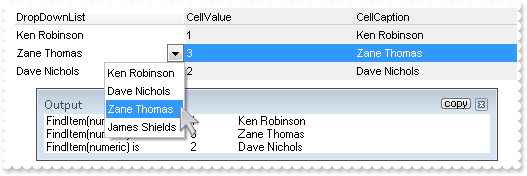
How do I find the predefined string for giving value, or giving identifier for specified predefined caption of editor
/*begin event Change(long  Item, long  ColIndex, any  NewValue) - Occurs when the user changes the cell's content.*/
/*
	oGrid = ole_1.Object
	MessageBox("Information",string( "FindItem(numeric) is " ))
	MessageBox("Information",string( String(NewValue) ))
	MessageBox("Information",string( String(oGrid.Columns.Item(0).Editor.FindItem(NewValue)) ))
*/
/*end event Change*/

OleObject oGrid,var_Column,var_Column1,var_Column2,var_Editor,var_Items

oGrid = ole_1.Object
oGrid.BeginUpdate()
var_Column = oGrid.Columns.Add("DropDownList")
	var_Editor = var_Column.Editor
		var_Editor.EditType = 3
		var_Editor.AddItem(1,"Ken Robinson")
		var_Editor.AddItem(2,"Dave Nichols")
		var_Editor.AddItem(3,"Zane Thomas")
		var_Editor.AddItem(4,"James Shields")
var_Column1 = oGrid.Columns.Add("CellValue")
	var_Column1.FormatColumn = "%0"
	var_Column1.Def(4,15790320)
	var_Column1.Def(7,var_Column1.Def(4))
var_Column2 = oGrid.Columns.Add("CellCaption")
	var_Column2.FormatColumn = "%C0"
	var_Column2.Def(4,15790320)
	var_Column2.Def(7,var_Column2.Def(4))
var_Items = oGrid.Items
	var_Items.AddItem(1)
	var_Items.AddItem(oGrid.Columns.Item(0).Editor.FindItem("Zane Thomas"))
	var_Items.AddItem(2)
oGrid.EndUpdate()
|
|
949
|
How can I align captions of items with checkbox, with items with no checkbox

OleObject oGrid,var_Items

oGrid = ole_1.Object
oGrid.BeginUpdate()
oGrid.Columns.Add("Default")
var_Items = oGrid.Items
	var_Items.CellImages(var_Items.AddItem(0),0,"1")
	var_Items.CellHasCheckBox(var_Items.AddItem(1),0,true)
	var_Items.CellImages(var_Items.AddItem(2),0,"1")
oGrid.EndUpdate()
|
|
948
|
How can I prevent sorting a column
OleObject oGrid,var_Column,var_Items
any h

oGrid = ole_1.Object
oGrid.BeginUpdate()
oGrid.LinesAtRoot = -1
var_Column = oGrid.Columns.Add("Default")
	var_Column.Def(0,true)
	var_Column.PartialCheck = true
	var_Column.AllowSort = false
var_Items = oGrid.Items
	h = var_Items.AddItem("Root")
	var_Items.InsertItem(h,,"Child 1")
	var_Items.InsertItem(h,,"Child 2")
	var_Items.ExpandItem(h,true)
oGrid.EndUpdate()
|
|
947
|
Is there a possibility to group without moving and showing the column to the SortBar
OleObject oGrid,rs

oGrid = ole_1.Object
oGrid.BeginUpdate()
oGrid.HasLines = 0
oGrid.ColumnAutoResize = false
rs = CREATE OLEObject
rs.ConnectToNewObject("ADOR.Recordset")
	rs.Open("Orders","Provider=Microsoft.ACE.OLEDB.12.0;Data Source=C:\Program Files\Exontrol\ExGrid\Sample\Access\misc.accdb",3,3)
oGrid.DataSource = rs
oGrid.SingleSort = false
oGrid.SortBarVisible = false
oGrid.AllowGroupBy = true
oGrid.Layout = "singlesort=" + CHAR(34) + "C5:1" + CHAR(34) + ";multiplesort=" + CHAR(34) + " C1:2" + CHAR(34) + ""
oGrid.EndUpdate()
|
|
946
|
How can I show each group header ( not-subroup ), with a different background color, while alternate background colors for inside items
/*begin event LayoutChanged() - Occurs when column's position or column's size is changed.*/
/*
	oGrid = ole_1.Object
	oGrid.Refresh()
*/
/*end event LayoutChanged*/

OleObject oGrid,rs,var_Column,var_Column1

oGrid = ole_1.Object
oGrid.BeginUpdate()
oGrid.HasLines = 0
oGrid.ColumnAutoResize = false
rs = CREATE OLEObject
rs.ConnectToNewObject("ADOR.Recordset")
	rs.Open("Orders","Provider=Microsoft.ACE.OLEDB.12.0;Data Source=C:\Program Files\Exontrol\ExGrid\Sample\Access\misc.accdb",3,3)
oGrid.DataSource = rs
oGrid.SingleSort = false
oGrid.SortBarVisible = true
oGrid.AllowGroupBy = true
oGrid.Columns.Item(1).SortOrder = true
var_Column = oGrid.Columns.Add("Position")
	var_Column.FormatColumn = "(0:= (1 rpos '')) right ( ( 1:= ( =:0 rfind `.` ) ) != -1 ? =:1 : len(=:0))"
	var_Column.Visible = false
var_Column1 = oGrid.Columns.Add("Position")
	var_Column1.FormatColumn = "(1 rpos '') contains '.'"
	var_Column1.Visible = false
oGrid.ConditionalFormats.Add("(%C13 mod 2) != 0").BackColor = RGB(240,240,240)
oGrid.ConditionalFormats.Add("%C14 = 0").BackColor = RGB(190,190,190)
oGrid.EndUpdate()
|
|
945
|
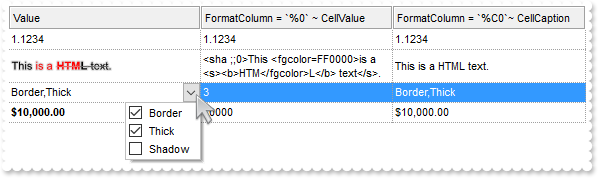
What is the difference between %0 and %C0, when using in expressions ( format, conditional format, computed fields, and so on )
OleObject oGrid,var_Column,var_Column1,var_Editor,var_Items

oGrid = ole_1.Object
oGrid.BeginUpdate()
oGrid.HeaderAppearance = 4
oGrid.HeaderHeight = 24
oGrid.ScrollBySingleLine = true
oGrid.DrawGridLines = -2
oGrid.Columns.Add("Value").Def(17,1)
var_Column = oGrid.Columns.Add("FormatColumn = `%0` ~ CellValue")
	var_Column.FormatColumn = "%0"
	var_Column.Def(16,false)
var_Column1 = oGrid.Columns.Add("FormatColumn = `%C0`~ CellCaption")
	var_Column1.FormatColumn = "%C0"
	var_Column1.Def(16,false)
var_Items = oGrid.Items
	var_Items.AddItem(1.1234)
	var_Items.CellValueFormat(var_Items.AddItem("<sha ;;0>This <fgcolor=FF0000>is a <s><b>HTM</fgcolor>L</b> text</s>."),0,1)
	var_Editor = var_Items.CellEditor(var_Items.AddItem(3))
		var_Editor.EditType = 6
		var_Editor.AddItem(1,"Border")
		var_Editor.AddItem(2,"Thick")
		var_Editor.AddItem(4,"Shadow")
	var_Items.FormatCell(var_Items.AddItem(10000),0,"`<b>` + currency(value)")
oGrid.EndUpdate()
|
|
944
|
How can I alternate colors for each group header ( not-subroup ), with a different background color, while items of the same group showing with a different color
/*begin event LayoutChanged() - Occurs when column's position or column's size is changed.*/
/*
	oGrid = ole_1.Object
	oGrid.Refresh()
*/
/*end event LayoutChanged*/

OleObject oGrid,rs,var_Column,var_Column1

oGrid = ole_1.Object
oGrid.BeginUpdate()
oGrid.HasLines = 0
oGrid.ColumnAutoResize = false
rs = CREATE OLEObject
rs.ConnectToNewObject("ADOR.Recordset")
	rs.Open("Orders","Provider=Microsoft.ACE.OLEDB.12.0;Data Source=C:\Program Files\Exontrol\ExGrid\Sample\Access\misc.accdb",3,3)
oGrid.DataSource = rs
oGrid.SingleSort = false
oGrid.SortBarVisible = true
oGrid.AllowGroupBy = true
oGrid.Columns.Item(1).SortOrder = true
var_Column = oGrid.Columns.Add("Position")
	var_Column.FormatColumn = "(0:= (1 rpos '')) left ( ( 1:= ( =:0 lfind `.` ) ) != -1 ? =:1 : len(=:0))"
	var_Column.Visible = false
var_Column1 = oGrid.Columns.Add("Position")
	var_Column1.FormatColumn = "(1 rpos '') contains '.'"
	var_Column1.Visible = false
oGrid.ConditionalFormats.Add("(%C13 mod 2) != 0").BackColor = RGB(240,240,240)
oGrid.ConditionalFormats.Add("%C14 = 0").BackColor = RGB(190,190,190)
oGrid.EndUpdate()
|
|
943
|
How can I highlight each group header, with a different background color (method 2)
/*begin event AddGroupItem(long  Item) - Occurs after a new Group Item has been inserted to Items collection.*/
/*
	oGrid = ole_1.Object
	oGrid.Items.ItemBackColor(Item,RGB(190,190,190))
*/
/*end event AddGroupItem*/

OleObject oGrid,rs

oGrid = ole_1.Object
oGrid.BeginUpdate()
oGrid.HasLines = 0
oGrid.ColumnAutoResize = false
rs = CREATE OLEObject
rs.ConnectToNewObject("ADOR.Recordset")
	rs.Open("Orders","Provider=Microsoft.ACE.OLEDB.12.0;Data Source=C:\Program Files\Exontrol\ExGrid\Sample\Access\misc.accdb",3,3)
oGrid.DataSource = rs
oGrid.SingleSort = false
oGrid.SortBarVisible = true
oGrid.AllowGroupBy = true
oGrid.Columns.Item(1).SortOrder = true
oGrid.EndUpdate()
|
|
942
|
How can I highlight each group header ( not-subroup ), with a different background color (method 1)
/*begin event LayoutChanged() - Occurs when column's position or column's size is changed.*/
/*
	oGrid = ole_1.Object
	oGrid.Refresh()
*/
/*end event LayoutChanged*/

OleObject oGrid,rs,var_Column,var_Column1

oGrid = ole_1.Object
oGrid.BeginUpdate()
oGrid.HasLines = 0
oGrid.ColumnAutoResize = false
rs = CREATE OLEObject
rs.ConnectToNewObject("ADOR.Recordset")
	rs.Open("Orders","Provider=Microsoft.ACE.OLEDB.12.0;Data Source=C:\Program Files\Exontrol\ExGrid\Sample\Access\misc.accdb",3,3)
oGrid.DataSource = rs
oGrid.SingleSort = false
oGrid.SortBarVisible = true
oGrid.AllowGroupBy = true
oGrid.Columns.Item(1).SortOrder = true
var_Column = oGrid.Columns.Add("Position")
	var_Column.FormatColumn = "(0:= (1 rpos '')) left ( ( 1:= ( =:0 lfind `.` ) ) != -1 ? =:1 : len(=:0))"
	var_Column.Visible = false
var_Column1 = oGrid.Columns.Add("Position")
	var_Column1.FormatColumn = "(1 rpos '') contains '.'"
	var_Column1.Visible = false
oGrid.ConditionalFormats.Add("%C14 = 0").BackColor = RGB(190,190,190)
oGrid.EndUpdate()
|
|
941
|
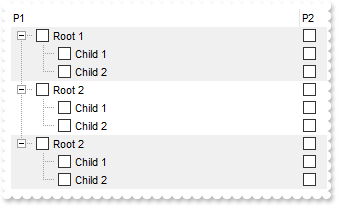
The BackColorAlternate displays each second row with a different background color. Is it possible to apply a different background color, for each sub-tree, ConditionalFormats, Add
/*begin event LayoutChanged() - Occurs when column's position or column's size is changed.*/
/*
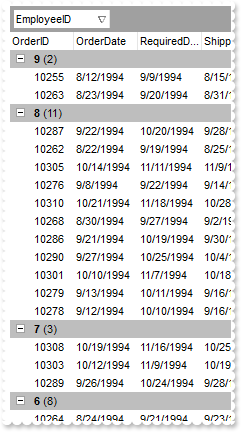
oGrid = ole_1.Object
oGrid.Refresh()
*/
/*end event LayoutChanged*/
/*begin event Sort() - Fired when the control sorts a column.*/
/*
oGrid = ole_1.Object
oGrid.Refresh()
*/
/*end event Sort*/
OleObject oGrid,var_Column,var_Column1,var_Column2,var_Items
any h
oGrid = ole_1.Object
oGrid.BeginUpdate()
oGrid.LinesAtRoot = -1
var_Column = oGrid.Columns.Add("P1")
var_Column.Def(0,true)
var_Column.PartialCheck = true
var_Column1 = oGrid.Columns.Add("P2")
var_Column1.Def(0,true)
var_Column1.PartialCheck = true
var_Items = oGrid.Items
h = var_Items.AddItem("Root 1")
var_Items.InsertItem(h,,"Child 1")
var_Items.InsertItem(h,,"Child 2")
var_Items.ExpandItem(h,true)
h = var_Items.AddItem("Root 2")
var_Items.InsertItem(h,,"Child 1")
var_Items.InsertItem(h,,"Child 2")
var_Items.ExpandItem(h,true)
h = var_Items.AddItem("Root 2")
var_Items.InsertItem(h,,"Child 1")
var_Items.InsertItem(h,,"Child 2")
var_Items.ExpandItem(h,true)
var_Column2 = oGrid.Columns.Add("Position")
var_Column2.FormatColumn = "(0:= (1 rpos '')) left ( ( 1:= ( =:0 lfind `.` ) ) != -1 ? =:1 : len(=:0))"
var_Column2.Visible = false
oGrid.ConditionalFormats.Add("(%C2 mod 2) != 0").BackColor = RGB(240,240,240)
oGrid.EndUpdate()
|
|
940
|
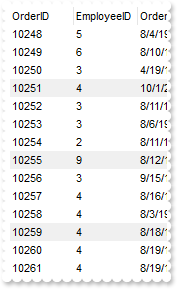
The BackColorAlternate displays each second row with a different background color. Is it possible to apply a different background color, for 2nd, 3rd, 4th, row, and so on
/*begin event LayoutChanged() - Occurs when column's position or column's size is changed.*/
/*
	oGrid = ole_1.Object
	oGrid.Refresh()
*/
/*end event LayoutChanged*/

/*begin event Sort() - Fired when the control sorts a column.*/
/*
	oGrid = ole_1.Object
	oGrid.Refresh()
*/
/*end event Sort*/

OleObject oGrid,rs,var_Column

oGrid = ole_1.Object
oGrid.BeginUpdate()
oGrid.HasLines = 0
oGrid.ColumnAutoResize = false
rs = CREATE OLEObject
rs.ConnectToNewObject("ADOR.Recordset")
	rs.Open("Orders","Provider=Microsoft.ACE.OLEDB.12.0;Data Source=C:\Program Files\Exontrol\ExGrid\Sample\Access\misc.accdb",3,3)
oGrid.DataSource = rs
var_Column = oGrid.Columns.Add("Position")
	var_Column.FormatColumn = "1 apos ''"
	var_Column.Visible = false
oGrid.ConditionalFormats.Add("(%C13 mod 5) = 1").BackColor = RGB(128,128,128)
oGrid.ConditionalFormats.Add("(%C13 mod 5) = 2").BackColor = RGB(164,164,164)
oGrid.ConditionalFormats.Add("(%C13 mod 5) = 3").BackColor = RGB(190,190,190)
oGrid.ConditionalFormats.Add("(%C13 mod 5) = 4").BackColor = RGB(240,240,240)
oGrid.EndUpdate()
|
|
939
|
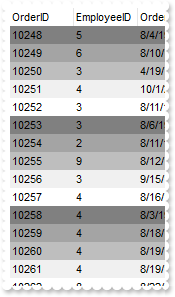
The BackColorAlternate displays each second row with a different background color. The question I have it is possible to apply a different background color for 3rd, 4th, row, and so on
/*begin event LayoutChanged() - Occurs when column's position or column's size is changed.*/
/*
	oGrid = ole_1.Object
	oGrid.Refresh()
*/
/*end event LayoutChanged*/

/*begin event Sort() - Fired when the control sorts a column.*/
/*
	oGrid = ole_1.Object
	oGrid.Refresh()
*/
/*end event Sort*/

OleObject oGrid,rs,var_Column

oGrid = ole_1.Object
oGrid.BeginUpdate()
oGrid.HasLines = 0
oGrid.ColumnAutoResize = false
rs = CREATE OLEObject
rs.ConnectToNewObject("ADOR.Recordset")
	rs.Open("Orders","Provider=Microsoft.ACE.OLEDB.12.0;Data Source=C:\Program Files\Exontrol\ExGrid\Sample\Access\misc.accdb",3,3)
oGrid.DataSource = rs
var_Column = oGrid.Columns.Add("Position")
	var_Column.FormatColumn = "1 apos ''"
	var_Column.Visible = false
oGrid.ConditionalFormats.Add("(%C13 mod 4) = 0").BackColor = RGB(240,240,240)
oGrid.EndUpdate()
|
|
938
|
The BackColorAlternate looks fine for flat tables, but how about using it when displaying a hierarchy/tree, like grouping rows. The sample alternate colors for each group found
/*begin event LayoutChanged() - Occurs when column's position or column's size is changed.*/
/*
	oGrid = ole_1.Object
	oGrid.Refresh()
*/
/*end event LayoutChanged*/

OleObject oGrid,rs,var_Column

oGrid = ole_1.Object
oGrid.BeginUpdate()
oGrid.HasLines = 0
oGrid.ColumnAutoResize = false
rs = CREATE OLEObject
rs.ConnectToNewObject("ADOR.Recordset")
	rs.Open("Orders","Provider=Microsoft.ACE.OLEDB.12.0;Data Source=C:\Program Files\Exontrol\ExGrid\Sample\Access\misc.accdb",3,3)
oGrid.DataSource = rs
oGrid.SingleSort = false
oGrid.SortBarVisible = true
oGrid.AllowGroupBy = true
oGrid.Columns.Item(1).SortOrder = true
var_Column = oGrid.Columns.Add("Position")
	var_Column.FormatColumn = "(0:= (1 rpos '')) left ( ( 1:= ( =:0 lfind `.` ) ) != -1 ? =:1 : len(=:0))"
	var_Column.Visible = false
oGrid.ConditionalFormats.Add("(%C13 mod 2) != 0").BackColor = RGB(240,240,240)
oGrid.EndUpdate()
|
|
937
|
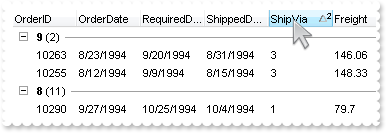
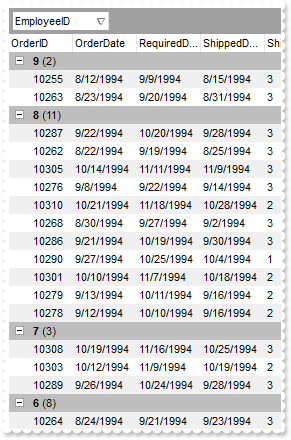
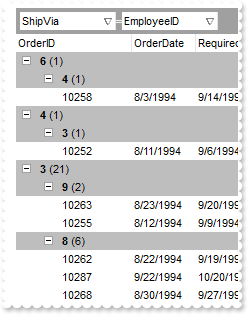
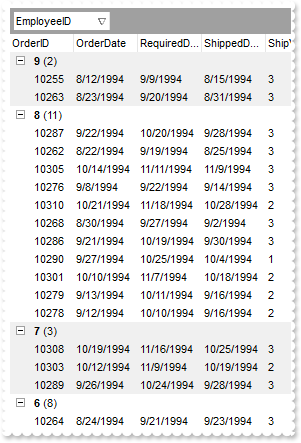
I need to display sub-totals in the grouping items. Is there any solution on this
/*begin event AddGroupItem(long  Item) - Occurs after a new Group Item has been inserted to Items collection.*/
/*
	OleObject var_Items
	oGrid = ole_1.Object
	var_Items = oGrid.Items
		var_Items.ItemDivider(Item,-1)
		var_Items.EnableItem(Item,false)
		var_Items.CellValueFormat(Item,oGrid.TreeColumnIndex,1)
		var_Items.FormatCell(Item,oGrid.TreeColumnIndex,"%1")
		var_Items.CellValueFormat(Item,"Freight",5 /*exTotalField | exHTML*/)
		var_Items.CellValue(Item,"Freight","sum(current,dir,%6)")
		var_Items.FormatCell(Item,"Freight","`<b>` + currency(value)")
*/
/*end event AddGroupItem*/

OleObject oGrid,rs

oGrid = ole_1.Object
oGrid.BeginUpdate()
oGrid.SelBackMode = 1
oGrid.BackColorSortBar = RGB(240,240,240)
oGrid.ColumnAutoResize = false
rs = CREATE OLEObject
rs.ConnectToNewObject("ADOR.Recordset")
	rs.Open("Orders","Provider=Microsoft.ACE.OLEDB.12.0;Data Source=C:\Program Files\Exontrol\ExGrid\Sample\Access\misc.accdb",3,3)
oGrid.DataSource = rs
oGrid.SortBarVisible = true
oGrid.SortBarCaption = "Drag a <b>column</b> header here to group by that column."
oGrid.AllowGroupBy = true
oGrid.Columns.Item(1).SortOrder = 1
oGrid.LinesAtRoot = 5
oGrid.Columns.Item("ShipVia").DisplayFilterButton = true
oGrid.EndUpdate()
|
|
936
|
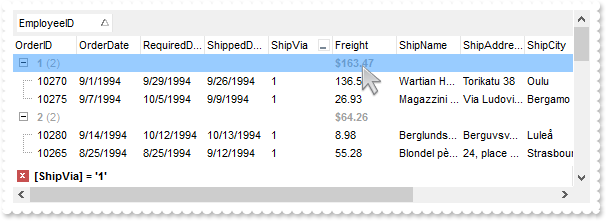
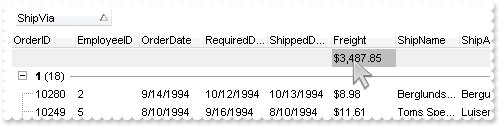
I use a subtotal in exTop-Item, after grouping the item shows 0. What is the solution
OleObject oGrid,rs,var_Items
any h

oGrid = ole_1.Object
oGrid.BeginUpdate()
oGrid.ColumnAutoResize = false
rs = CREATE OLEObject
rs.ConnectToNewObject("ADOR.Recordset")
	rs.Open("Orders","Provider=Microsoft.ACE.OLEDB.12.0;Data Source=C:\Program Files\Exontrol\ExGrid\Sample\Access\misc.accdb",3,3)
oGrid.DataSource = rs
oGrid.SingleSort = false
oGrid.AllowGroupBy = true
oGrid.SortBarVisible = true
oGrid.BackColorSortBar = oGrid.BackColor
oGrid.Columns.Item(5).SortOrder = 1
oGrid.Columns.Item(6).FormatColumn = "currency(value)"
var_Items = oGrid.Items
	var_Items.LockedItemCount(0,1)
	h = var_Items.LockedItem(0,0)
	var_Items.ItemBackColor(h,RGB(240,240,240))
	var_Items.CellBackColor(h,6,RGB(190,190,190))
	var_Items.CellValue(h,6,"sum(all,rec,%6)")
	var_Items.CellValueFormat(h,6,4)
oGrid.Refresh()
oGrid.EndUpdate()
|
|
935
|
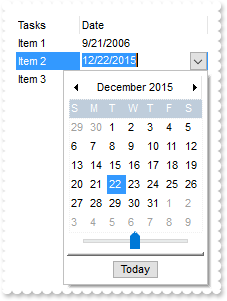
I would like to avoid manual typing in the date-cell because user often type wrong things (no decimal points and so on) and so the todays-date is generated for the cell. What can be done
/*begin event KeyPress(integer  KeyAscii) - Occurs when the user presses and releases an ANSI key.*/
/*
	oGrid = ole_1.Object
	MessageBox("Information",string( "if .Editying != 0 then" ))
	MessageBox("Information",string( String(oGrid.Editing) ))
	KeyAscii = 0
*/
/*end event KeyPress*/

OleObject oGrid,var_Column,var_Columns,var_Items

oGrid = ole_1.Object
oGrid.BeginUpdate()
oGrid.ColumnAutoResize = false
var_Columns = oGrid.Columns
	var_Columns.Add("Tasks")
	var_Column = var_Columns.Add("Date")
		var_Column.Editor.EditType = 7
		var_Column.Width = 128
var_Items = oGrid.Items
	var_Items.CellValue(var_Items.AddItem("Item 1"),1,2006-09-21)
	var_Items.CellValue(var_Items.AddItem("Item 2"),1,2015-12-22)
	var_Items.CellValue(var_Items.AddItem("Item 3"),1,2015-01-10)
oGrid.EndUpdate()
|
|
934
|
The control does not ensure the item to fit the control's client area once the user clicks the cell's button or check box. What can be done
/*begin event MouseDown(integer  Button, integer  Shift, long  X, long  Y) - Occurs when the user presses a mouse button.*/
/*
	Items.EnsureVisibleItem(ItemFromPoint(-1,-1,c,hit))
	oGrid = ole_1.Object
*/
/*end event MouseDown*/

OleObject oGrid,var_Column,var_Items

oGrid = ole_1.Object
oGrid.BeginUpdate()
oGrid.TreeColumnIndex = -1
oGrid.SelForeColor = oGrid.ForeColor
var_Column = oGrid.Columns.Add("Buttons")
	var_Column.Alignment = 1
	var_Column.Def(2,true)
var_Items = oGrid.Items
	var_Items.AddItem("Button A")
	var_Items.AddItem("Button B")
	var_Items.AddItem("Button C")
oGrid.EndUpdate()
|
|
933
|
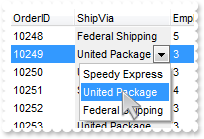
How do you save the index number from a drop down to a database
OleObject oGrid,rs,var_Column,var_Editor

oGrid = ole_1.Object
oGrid.BeginUpdate()
oGrid.ColumnAutoResize = false
rs = CREATE OLEObject
rs.ConnectToNewObject("ADOR.Recordset")
	rs.Open("Orders","Provider=Microsoft.ACE.OLEDB.12.0;Data Source=C:\Program Files\Exontrol\ExGrid\Sample\Access\misc.accdb",3,3)
oGrid.DataSource = rs
var_Column = oGrid.Columns.Item("ShipVia")
	var_Column.Def(4,15790320)
	var_Column.Position = 1
	var_Column.Width = 96
	var_Editor = var_Column.Editor
		var_Editor.EditType = 3
		var_Editor.AddItem(1,"Speedy Express")
		var_Editor.AddItem(2,"United Package")
		var_Editor.AddItem(3,"Federal Shipping")
oGrid.EndUpdate()
|
|
932
|
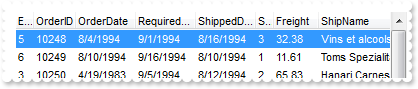
Is there a way to set the column width and have it stay when refreshing using the data source
OleObject oGrid,rs

oGrid = ole_1.Object
oGrid.BeginUpdate()
oGrid.ColumnAutoResize = false
rs = CREATE OLEObject
rs.ConnectToNewObject("ADOR.Recordset")
	rs.Open("Orders","Provider=Microsoft.ACE.OLEDB.12.0;Data Source=C:\Program Files\Exontrol\ExGrid\Sample\Access\misc.accdb",3,3)
oGrid.DataSource = rs
oGrid.Layout = "gBjAAwAAuABmABpABsAB0ABlAByhoAPIAOEPAA9gYABoABQAgUEg0XN4AOcJicKkpujIAGMcj0gjcGk8QhkQgUOjUEjsfkMFAB2lEnhRihcYjUvnsykQAO8oMkTNEtGgAGUwn0uoEIhUMh0QiUOisXiE7rEyl8jAElokptYAllmpcCtMmjE3mU6jdzrUGoUKttGvFJs90oFPhVRh1Twg4wtaptco9fiMTsdIvcxw1Nkl2hUOlVwlsvnmayFAmtHnETuWm0lAv+eAGCzFK10zp1QqVUAGOvkvuuSr0YsMUi2Y0tZ4FAztt0FvuNa23Kvt2m0YnMt5No6uxwOq0eP5cGxAAxQAxgAGwAqu/q1blHDsGW49lzPUq9qtko58r8Krvc/LrPA7LWvw2ChpQ2j7Om7kBPK870hu+6ZQE4SJvmsT6u0x8BOa/iUP8jUANNATUrxAsKIFATvQU8DCL5B7dMWlr1u2gQZvgrsMMrDSyQ4vkcv02T+tEjUcyC1C7uw1kVABISgwSosXq1JLyRm9EaycqqDQuyjisu+0bvY5i3udEMjTIvkuQHFEmzHNkWymwcqtNNkIN2jUbMeGsdMm4j6R/AyZT7IcztC6M+r5Qs2yYvUx0ZOTZypBqBUZPEaMax71y6+MeTBDdBoFTjjv2z80Oi9a+VJE9HSA01SUlBbw1Ww8sPSqtFNNCdOx3L9AuQx9eVLIlUJbCa+WHVrV0fYUEMBF06UqAFh0xLLCT7abHV7P8MuNQUnW3YlDuglrfNNcVlrzV6s3FWVKMfcVrPSq6rva0wcz8+Ue2/YK+XzQ0QUQlt83/JTr2ZdiZYBKNoTm2rH4ZedzSckqGDqAA2tEk7CSQmKEJKgWMY5CmQJlkaZYsAGMY0liFJYqKIDxhSpjCu0vUBQappOgSJZUhlBtTmyJIEqaBZVljRZe8yMZnoMl4SjQRI3qal3U7OjqPpOXNFmIAadCiHIkiDV6RjOla7puFKFnjK5/ta7Z6t6GIYkqEIQ1NmqWgIA="
oGrid.EndUpdate()
|
|
931
|
Is it possible to decode/view the control's Layout property
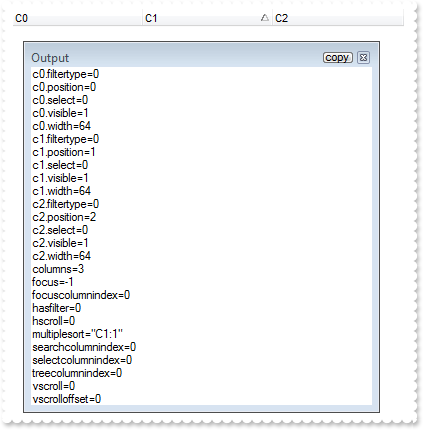
OleObject oGrid,var_Print

oGrid = ole_1.Object
oGrid.BeginUpdate()
oGrid.SingleSort = false
oGrid.Columns.Add("C0")
oGrid.Columns.Add("C1").SortOrder = 1
oGrid.Columns.Add("C2")
var_Print = CREATE OLEObject
var_Print.ConnectToNewObject("Exontrol.Print")
	MessageBox("Information",string( var_Print.Decode64TextW(oGrid.Layout) ))
oGrid.EndUpdate()
|
|
930
|
How do I programmatically sort by multiple columns
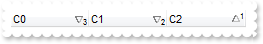
OleObject oGrid

oGrid = ole_1.Object
oGrid.BeginUpdate()
oGrid.SingleSort = false
oGrid.Columns.Add("C0")
oGrid.Columns.Add("C1")
oGrid.Columns.Add("C2")
oGrid.Layout = "multiplesort=" + CHAR(34) + "C2:1 C1:2 C0:2" + CHAR(34) + ""
oGrid.EndUpdate()
|
|
929
|
Do you have any Fit-To-Page options when printing the control (W x T, Fit-To )
OleObject oGrid,rs,var_Print

oGrid = ole_1.Object
oGrid.BeginUpdate()
oGrid.ColumnAutoResize = false
oGrid.ContinueColumnScroll = false
rs = CREATE OLEObject
rs.ConnectToNewObject("ADOR.Recordset")
	rs.Open("Orders","Provider=Microsoft.ACE.OLEDB.12.0;Data Source=C:\Program Files\Exontrol\ExGrid\Sample\Access\misc.accdb",3,3)
oGrid.DataSource = rs
oGrid.EndUpdate()
var_Print = CREATE OLEObject
var_Print.ConnectToNewObject("Exontrol.Print")
	var_Print.Options = "FitToPage =2 x 1"
	var_Print.PrintExt = oGrid.Object
	var_Print.Preview()
|
|
928
|
Do you have any Fit-To-Page options when printing the control ( x T, Fit-To Tall )
OleObject oGrid,rs,var_Print

oGrid = ole_1.Object
oGrid.BeginUpdate()
oGrid.ColumnAutoResize = false
oGrid.ContinueColumnScroll = false
rs = CREATE OLEObject
rs.ConnectToNewObject("ADOR.Recordset")
	rs.Open("Orders","Provider=Microsoft.ACE.OLEDB.12.0;Data Source=C:\Program Files\Exontrol\ExGrid\Sample\Access\misc.accdb",3,3)
oGrid.DataSource = rs
oGrid.EndUpdate()
var_Print = CREATE OLEObject
var_Print.ConnectToNewObject("Exontrol.Print")
	var_Print.Options = "FitToPage = x 2"
	var_Print.PrintExt = oGrid.Object
	var_Print.Preview()
|
|
927
|
Do you have any Fit-To-Page options when printing the control ( W x, Fit-To Wide )
OleObject oGrid,rs,var_Print

oGrid = ole_1.Object
oGrid.BeginUpdate()
oGrid.ColumnAutoResize = false
oGrid.ContinueColumnScroll = false
rs = CREATE OLEObject
rs.ConnectToNewObject("ADOR.Recordset")
	rs.Open("Orders","Provider=Microsoft.ACE.OLEDB.12.0;Data Source=C:\Program Files\Exontrol\ExGrid\Sample\Access\misc.accdb",3,3)
oGrid.DataSource = rs
oGrid.EndUpdate()
var_Print = CREATE OLEObject
var_Print.ConnectToNewObject("Exontrol.Print")
	var_Print.Options = "FitToPage = 2 x"
	var_Print.PrintExt = oGrid.Object
	var_Print.Preview()
|
|
926
|
Do you have any Fit-To-Page options when printing the control ( percent view, Adjust-To )
OleObject oGrid,rs,var_Print

oGrid = ole_1.Object
oGrid.BeginUpdate()
oGrid.ColumnAutoResize = false
oGrid.ContinueColumnScroll = false
rs = CREATE OLEObject
rs.ConnectToNewObject("ADOR.Recordset")
	rs.Open("Orders","Provider=Microsoft.ACE.OLEDB.12.0;Data Source=C:\Program Files\Exontrol\ExGrid\Sample\Access\misc.accdb",3,3)
oGrid.DataSource = rs
oGrid.EndUpdate()
var_Print = CREATE OLEObject
var_Print.ConnectToNewObject("Exontrol.Print")
	var_Print.Options = "FitToPage = 50%"
	var_Print.PrintExt = oGrid.Object
	var_Print.Preview()
|
|
925
|
How can I get notified once the user expands a column
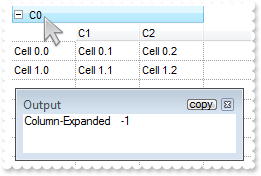
/*begin event LayoutChanged() - Occurs when column's position or column's size is changed.*/
/*
	oGrid = ole_1.Object
	MessageBox("Information",string( "Column-Expanded" ))
	MessageBox("Information",string( String(oGrid.Columns.Item("C0").Expanded) ))
*/
/*end event LayoutChanged*/

OleObject oGrid,var_Column,var_Columns,var_Items
any h

oGrid = ole_1.Object
oGrid.BeginUpdate()
oGrid.ShowFocusRect = false
oGrid.ColumnAutoResize = false
oGrid.DrawGridLines = -1
oGrid.BackColorLevelHeader = oGrid.BackColor
var_Columns = oGrid.Columns
	var_Column = var_Columns.Add("C0")
		var_Column.ExpandColumns = "0,1,2"
		var_Column.DisplayExpandButton = true
	var_Columns.Add("C1")
	var_Columns.Add("C2")
var_Items = oGrid.Items
	h = var_Items.AddItem("Cell 0.0")
	var_Items.CellValue(h,1,"Cell 0.1")
	var_Items.CellValue(h,2,"Cell 0.2")
	h = var_Items.AddItem("Cell 1.0")
	var_Items.CellValue(h,1,"Cell 1.1")
	var_Items.CellValue(h,2,"Cell 1.2")
oGrid.EndUpdate()
|
|
924
|
I am using expandable headers, the question is how I can display the column itself, not just the child columns
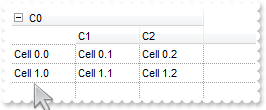
OleObject oGrid,var_Column,var_Columns,var_Items
any h

oGrid = ole_1.Object
oGrid.BeginUpdate()
oGrid.ColumnAutoResize = false
oGrid.DrawGridLines = -1
oGrid.BackColorLevelHeader = oGrid.BackColor
var_Columns = oGrid.Columns
	var_Column = var_Columns.Add("C0")
		var_Column.ExpandColumns = "0,1,2"
		var_Column.DisplayExpandButton = true
	var_Columns.Add("C1")
	var_Columns.Add("C2")
var_Items = oGrid.Items
	h = var_Items.AddItem("Cell 0.0")
	var_Items.CellValue(h,1,"Cell 0.1")
	var_Items.CellValue(h,2,"Cell 0.2")
	h = var_Items.AddItem("Cell 1.0")
	var_Items.CellValue(h,1,"Cell 1.1")
	var_Items.CellValue(h,2,"Cell 1.2")
oGrid.EndUpdate()
|
|
923
|
How do I layout expandable columns
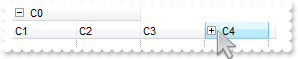
OleObject oGrid,var_Column,var_Column1,var_Column2,var_Columns

oGrid = ole_1.Object
oGrid.BeginUpdate()
oGrid.ColumnAutoResize = false
oGrid.DrawGridLines = -1
oGrid.BackColorLevelHeader = oGrid.BackColor
var_Columns = oGrid.Columns
	var_Column = var_Columns.Add("C0")
		var_Column.ExpandColumns = "1,2"
		var_Column.DisplayExpandButton = true
	var_Columns.Add("C1")
	var_Columns.Add("C2")
	var_Columns.Add("C3")
	var_Column1 = var_Columns.Add("C4")
		var_Column1.ExpandColumns = "5,6"
		var_Column1.DisplayExpandButton = true
	var_Columns.Add("C5")
	var_Column2 = var_Columns.Add("C6")
		var_Column2.ExpandColumns = "6,7"
		var_Column2.DisplayExpandButton = true
	var_Columns.Add("C7")
oGrid.EndUpdate()
oGrid.Columns.Item("C4").Expanded = false
|
|
922
|
How do I make the control read-only (method 2)
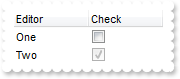
/*begin event Edit(long  Item, long  ColIndex, boolean  Cancel) - Occurs just before editing the focused cell.*/
/*
	oGrid = ole_1.Object
	Cancel = true
*/
/*end event Edit*/

OleObject oGrid,var_Column,var_Editor,var_Editor1,var_Items

oGrid = ole_1.Object
oGrid.BeginUpdate()
var_Editor = oGrid.Columns.Add("Editor").Editor
	var_Editor.EditType = 6
	var_Editor.AddItem(1,"One")
	var_Editor.AddItem(2,"Two")
var_Column = oGrid.Columns.Add("Check")
	var_Editor1 = var_Column.Editor
		var_Editor1.EditType = 19
		var_Editor1.Option(16,2)
var_Items = oGrid.Items
	var_Items.CellValue(var_Items.AddItem(1),1,0)
	var_Items.CellValue(var_Items.AddItem(2),1,1)
oGrid.EndUpdate()
|
|
921
|
How do I set a locked check-box
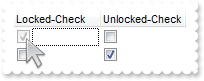
OleObject oGrid,var_Column,var_Column1,var_Editor,var_Editor1,var_Items

oGrid = ole_1.Object
oGrid.BeginUpdate()
var_Column = oGrid.Columns.Add("Locked-Check")
	var_Editor = var_Column.Editor
		var_Editor.EditType = 19
		var_Editor.Option(16,2)
		var_Editor.Locked = true
var_Column1 = oGrid.Columns.Add("Unlocked-Check")
	var_Editor1 = var_Column1.Editor
		var_Editor1.EditType = 19
		var_Editor1.Option(17,1)
var_Items = oGrid.Items
	var_Items.CellValue(var_Items.AddItem(1),1,0)
	var_Items.CellValue(var_Items.AddItem(0),1,1)
oGrid.EndUpdate()
|
|
920
|
Does the title of the cell's tooltip supports HTML format
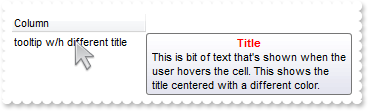
OleObject oGrid,var_Column,var_Items

oGrid = ole_1.Object
oGrid.BeginUpdate()
var_Column = oGrid.Columns.Add("")
	var_Column.Caption = ""
	var_Column.HTMLCaption = "Column"
var_Items = oGrid.Items
	var_Items.CellToolTip(var_Items.AddItem("tooltip w/h different title"),0,"<c><b><fgcolor=FF0000>Title</fgcolor></b><br>This is bit of text that's shown when the user hovers the cell. This shows the title centered with a different color.")
oGrid.EndUpdate()
|
|
919
|
How do I specify a different title for the cell's tooltip
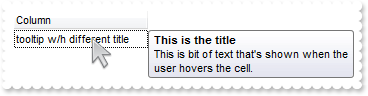
OleObject oGrid,var_Column,var_Items

oGrid = ole_1.Object
oGrid.BeginUpdate()
var_Column = oGrid.Columns.Add("")
	var_Column.Caption = "This is the title"
	var_Column.HTMLCaption = "Column"
var_Items = oGrid.Items
	var_Items.CellToolTip(var_Items.AddItem("tooltip w/h different title"),0,"This is bit of text that's shown when the user hovers the cell.")
oGrid.EndUpdate()
|
|
918
|
The cell's tooltip displays the column's caption in its title. How can I get ride of that
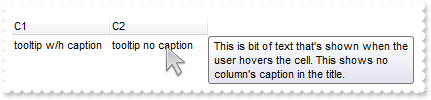
OleObject oGrid,var_Column,var_Columns,var_Items
any h

oGrid = ole_1.Object
oGrid.BeginUpdate()
var_Columns = oGrid.Columns
	var_Columns.Add("C1")
	var_Columns.Add("C2")
var_Items = oGrid.Items
	h = var_Items.AddItem("tooltip w/h caption")
	var_Items.CellToolTip(h,0,"This is bit of text that's shown when the user hovers the cell. This shows the column's caption in the title.")
	var_Items.CellValue(h,1,"tooltip no caption")
	var_Items.CellToolTip(h,1,"This is bit of text that's shown when the user hovers the cell. This shows no column's caption in the title.")
var_Column = oGrid.Columns.Item("C2")
	var_Column.HTMLCaption = var_Column.Caption
	var_Column.Caption = ""
oGrid.EndUpdate()
|
|
917
|
How can I programmatically show the column's filter
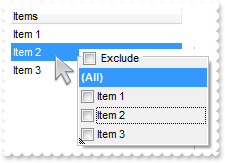
/*begin event RClick() - Fired when right mouse button is clicked*/
/*
	any i
	oGrid = ole_1.Object
	i = oGrid.ItemFromPoint(-1,-1,c,hit)
	oGrid.Columns.Item(c).ShowFilter("-1,-1,128,128")
*/
/*end event RClick*/

OleObject oGrid,var_Column,var_Items

oGrid = ole_1.Object
oGrid.BeginUpdate()
oGrid.ShowFocusRect = false
var_Column = oGrid.Columns.Add("Items ")
	var_Column.DisplayFilterPattern = false
	var_Column.FilterList = 9472 /*exShowExclude | exShowFocusItem | exShowCheckBox*/
var_Items = oGrid.Items
	var_Items.AddItem("Item 1")
	var_Items.AddItem("Item 2")
	var_Items.AddItem("Item 3")
oGrid.EndUpdate()
|
|
916
|
I want to be able to click on one of the headers, and sort by other column. How can I do that (method 2)
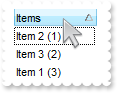
/*begin event ColumnClick(oleobject  Column) - Fired after the user clicks on column's header.*/
/*
	Column.SortOrder = 1
	oGrid = ole_1.Object
	oGrid.SortOnClick = -1
	oGrid.Columns.Item("Sort").SortOrder = 1
	oGrid.SortOnClick = 1
*/
/*end event ColumnClick*/

OleObject oGrid,var_Items

oGrid = ole_1.Object
oGrid.BeginUpdate()
oGrid.SortOnClick = 1
oGrid.Columns.Add("Items")
oGrid.Columns.Add("Sort").Visible = false
var_Items = oGrid.Items
	var_Items.CellValue(var_Items.AddItem("Item 1 (3)"),1,3)
	var_Items.CellValue(var_Items.AddItem("Item 2 (1)"),1,1)
	var_Items.CellValue(var_Items.AddItem("Item 3 (2)"),1,2)
oGrid.EndUpdate()
|
|
915
|
I want to be able to click on one of the headers, and sort by other column. How can I do that (method 1)
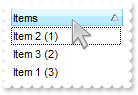
/*begin event ColumnClick(oleobject  Column) - Fired after the user clicks on column's header.*/
/*
	Column.SortOrder = 1
	oGrid = ole_1.Object
	oGrid.Items.SortChildren(0,"Sort",true)
*/
/*end event ColumnClick*/

OleObject oGrid,var_Items

oGrid = ole_1.Object
oGrid.BeginUpdate()
oGrid.SortOnClick = 1
oGrid.Columns.Add("Items")
oGrid.Columns.Add("Sort").Visible = false
var_Items = oGrid.Items
	var_Items.CellValue(var_Items.AddItem("Item 1 (3)"),1,3)
	var_Items.CellValue(var_Items.AddItem("Item 2 (1)"),1,1)
	var_Items.CellValue(var_Items.AddItem("Item 3 (2)"),1,2)
oGrid.EndUpdate()
|
|
914
|
How can I highlight the cell's button with a different appearance, when cursor hovers it
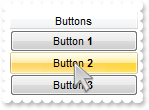
OleObject oGrid,var_Column,var_Items

oGrid = ole_1.Object
oGrid.BeginUpdate()
oGrid.VisualAppearance.Add(1,"c:\exontrol\images\normal.ebn")
oGrid.DefaultItemHeight = 22
oGrid.TreeColumnIndex = -1
oGrid.SelForeColor = RGB(0,0,0)
oGrid.SelBackColor = oGrid.BackColor
oGrid.Background(157,16777216 /*0x1000000*/)
var_Column = oGrid.Columns.Add("Buttons")
	var_Column.Def(2,true)
	var_Column.Def(17,1)
	var_Column.Alignment = 1
	var_Column.HeaderAlignment = 1
var_Items = oGrid.Items
	var_Items.AddItem("Button <b>1</b>")
	var_Items.AddItem("Button <b>2</b>")
	var_Items.AddItem("Button <b>3</b>")
oGrid.EndUpdate()
|
|
913
|
How can I prevent highlighting the cell's button while cursor hovers it
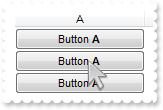
/*begin event AddItem(long  Item) - Occurs after a new Item has been inserted to Items collection.*/
/*
	OleObject var_Items
	oGrid = ole_1.Object
	var_Items = oGrid.Items
		var_Items.CellValue(Item,0,"Button <b>A</b>")
		var_Items.CellValue(Item,1,"Button <b>B</b>")
*/
/*end event AddItem*/

OleObject oGrid,var_Column,var_Column1,var_Items

oGrid = ole_1.Object
oGrid.BeginUpdate()
oGrid.DefaultItemHeight = 22
oGrid.TreeColumnIndex = -1
oGrid.SelForeColor = RGB(0,0,0)
oGrid.SelBackColor = oGrid.BackColor
oGrid.Background(157,-1)
var_Column = oGrid.Columns.Add("A")
	var_Column.Def(2,true)
	var_Column.Def(17,1)
	var_Column.Alignment = 1
	var_Column.HeaderAlignment = 1
var_Column1 = oGrid.Columns.Add("B")
	var_Column1.Def(2,true)
	var_Column1.Def(17,1)
	var_Column1.Alignment = 1
	var_Column1.HeaderAlignment = 1
oGrid.Columns.Add("").Position = 1
var_Items = oGrid.Items
	var_Items.CellEnabled(var_Items.AddItem(""),1,false)
	var_Items.AddItem("")
	var_Items.AddItem("")
oGrid.EndUpdate()
|
|
912
|
How can I change the image of the icon while performing OLE Drag and Drop
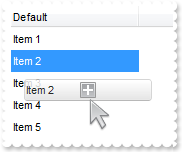
/*begin event OLEStartDrag(oleobject  Data, long  AllowedEffects) - Occurs when the OLEDrag method is called.*/
/*
	Data.SetData("your data to drag")
	oGrid = ole_1.Object
	AllowedEffects = 2
*/
/*end event OLEStartDrag*/

OleObject oGrid,var_Appearance,var_Items

oGrid = ole_1.Object
oGrid.BeginUpdate()
oGrid.OLEDropMode = 1
oGrid.ColumnAutoResize = false
oGrid.DefaultItemHeight = 22
oGrid.HeaderHeight = oGrid.DefaultItemHeight
oGrid.Columns.Add("Default").Width = 128
var_Items = oGrid.Items
	var_Items.AddItem("Item 1")
	var_Items.AddItem("Item 2")
	var_Items.AddItem("Item 3")
	var_Items.AddItem("Item 4")
	var_Items.AddItem("Item 5")
var_Appearance = oGrid.VisualAppearance
	var_Appearance.Add(1,"gBFLBCJwBAEHhEJAAChABakMACAADACAxRDQNABQKAAzQFAYaBiG6GAAGEaRYgmFgAQhFcZQSKUOQTDKMIziYBYfgkMIgSbJUgDGAkRRdDSOYDmGQYDiCIoRShOMIjHLUXxtDaIZwhEAoJb+RgAUY/cTzaAEUwHHiTKInaCQIhsC4JUJAdRURQ9EwvCIZBpEWwLChENQwWLCNj2TScBwjCyqbale45ViqdoDU8lORLUi+M4zSBPcZVTRtGShPDBKTjMLaYgkIIlVpRNa0PC1GTzQ6mazkKQLRADDIDVbAeL3LiMBy9LyLLItQALByua5mWhbcZyBCOPgBTrRb5zO58FjuTK7YLjMB7NrUNYtFaUMy2OpOCADIaecTNcaWLxPF2MY1HWYxVj2Jw3DuRJonKYB5lKAYkkYdA6hyDIjBkApaFoAAhBMfYxiGNAkFECZnm4YQBgiOgDl2URSE4KAEj2AJKigFgGgGYIIAyPQ6CCRogAAOxhAMSgSDgIRDhYFoFmGCBmBQOAMjgdgQDsUITEIIg5iISAEmIOBigiJgqgqYhoFyVILyyMgyDmYxDg4rBjgiZg6g0Dh4kiTIMGMKAwmgOQkEkFhGhGZIJAoPoQAyQ4mE6BhlAkRgXhODoZC0A4Pg6KRmCSFplkkdheDmJYTioVgACOY4uGaDwmgmJhqg8JlWmOGRmGkChyhyZxJAobYbmMI4yHqFQnkmdh+2RYp4DMIZ5gaBohmiCYGB+IJOmoNhtiPXZGG2I1tgyb4lmgGhmhqJt0Fyb4gk8CtsCiahKhYH4oXiAohiUKpKjaLt+goDJxiyaZqlaNot4OTJx3gKp2iiL5sAsBoov+KgMnOMZrisJpKjLjocnPeBLEaRI0m0SxWkSNBPEoDJ1jabJrHaXo35obOZC2OximaOZugsYpi3ga42mKO5vAuRpijsTxqAyd49m8S5mnqPuqFyd4gk+DAGn6QJwEwFp+kAT+BnmQpwgwNwOkPtYsnnrgsFcEpFnGDBnBKRRPiwUw" &
	 +"ckecgMgcIpHGMKQwnuSZygyJ1/HKOgMnyS5zAyRwykycw5g4Eg0jCA57DqTpzkydw+kIDR9AUCY9A2HQXBIUh0g0JRJ5aUxmnQZIPnkUgvDUI5tFcVoPjUOB+A4QBAICA")
	var_Appearance.Add(2,"gBFLBCJwBAEHhEJAAChABC8MACAADACAxRDQNABQKAAzQFAYaBiG6GAAGEaRYgmFgAQhFcZQSKUOQTDKMIziaQIRDINQlSTJcQjKKEUQTFiXIyAKKwEgmEQMQiCcbzXIUBxAAqXZZFUaKAgOMJDTLBAzUTCQbR7HiQYyBeCQOo+VoaSACEIlAZJRjoOo5DJGGQILlQJqyYrpaAxIgkEJuTqGoQaXgle53PJeLpXW5Nez9P7AMBwK7bbaqeTyXa+eDtJhif4cXjIMhyLI8UxXEKOL7jDSYPgqK48QhCEJQPQ9EyXJqnahoemCeRXBZ+aqxbBsCwCep0YBeNr3HaNaz3PK/brtWxMDpeA5IYhhF7WdZFR4tMrOdAtHL9FyPJ5TFicgXnoTAKAsRpHPeVhrAUd4LkmY5yj+fQ+i8L4zk+Y5vjCe4oD6ZoNhSRxiisVRKg+T5vnWfB6h6J5yAIf4fieWJFHyHZHHSTAygyAociMKBKEKBIeCiCZyHYFAnCAB4mBeBQJlgRIegOCgYCySAgh2WAkgINAMmMNIgCcCYoGYLoLmKaIshqCgMliEICgmDRDEiUQmkmAhWDCD5inicIVg4TQYloJg2g2ExYhoJZJEidIThMCQSFyEwkGKaRKFEJQJBkOhLCUJIDFoRiKBmBJhDeDZZDoPAlgmQhghaGZimmHhphqZopDoYw3GYEgFgGHROGOFJkCSSQCDoTAkiSaQ6C6IBJFkPIUCSJ5CDoeQ5CcVZ5gWHROmONJsCMSISByEFyjIRoYiaKYaG6HonEiOhcguJQIHoRJsh0WBWB2JIpiqShKi0OwqnqRouiyTpGhGBxiYIZKOhqGp2j4aRaAqZL3FAECAgA==")
oGrid.Background(33,16777216 /*0x1000000*/)
oGrid.Background(34,33554432 /*0x2000000*/)
oGrid.Background(37,RGB(0,0,1))
oGrid.EndUpdate()
|
|
911
|
How can I sort by two-columns, one by date and one by time
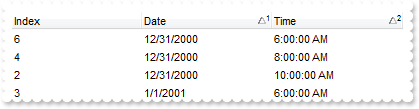
OleObject oGrid,var_Column,var_Columns,var_Items
any h

oGrid = ole_1.Object
oGrid.BeginUpdate()
oGrid.SingleSort = false
var_Columns = oGrid.Columns
	var_Columns.Add("Index").FormatColumn = "1 index ``"
	var_Columns.Add("Date").SortType = 2
	var_Column = var_Columns.Add("Time")
		var_Column.SortType = 4
		var_Column.FormatColumn = "time(value)"
var_Items = oGrid.Items
	h = var_Items.AddItem(0)
	var_Items.CellValue(h,1,2001-01-01)
	var_Items.CellValue(h,2,DateTime(2001-01-01,10:00:00))
	h = var_Items.AddItem(0)
	var_Items.CellValue(h,1,2000-12-31)
	var_Items.CellValue(h,2,DateTime(2001-01-01,10:00:00))
	h = var_Items.AddItem(0)
	var_Items.CellValue(h,1,2001-01-01)
	var_Items.CellValue(h,2,DateTime(2001-01-01,06:00:00))
	h = var_Items.AddItem(0)
	var_Items.CellValue(h,1,2000-12-31)
	var_Items.CellValue(h,2,DateTime(2001-01-01,08:00:00))
	h = var_Items.AddItem(0)
	var_Items.CellValue(h,1,2001-01-01)
	var_Items.CellValue(h,2,DateTime(2001-01-01,08:00:00))
	h = var_Items.AddItem(0)
	var_Items.CellValue(h,1,2000-12-31)
	var_Items.CellValue(h,2,DateTime(2001-01-01,06:00:00))
oGrid.Layout = "multiplesort=" + CHAR(34) + "C1:1 C2:1" + CHAR(34) + ""
oGrid.EndUpdate()
|
|
910
|
How can I display a context menu
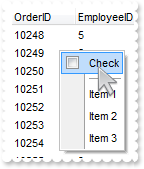
/*begin event MouseUp(integer  Button, integer  Shift, long  X, long  Y) - Occurs when the user releases a mouse button.*/
/*
	OleObject var_ExContextMenu
	oGrid = ole_1.Object
	var_ExContextMenu = CREATE OLEObject
	var_ExContextMenu.ConnectToNewObject("Exontrol.ContextMenu")
		var_ExContextMenu.Items.ToString = "Check[chk],[sep],Item 1,Item 2,Item 3"
		MessageBox("Information",string( String(var_ExContextMenu.Select()) ))
*/
/*end event MouseUp*/

OleObject oGrid,rs

oGrid = ole_1.Object
oGrid.ColumnAutoResize = false
oGrid.ScrollBySingleLine = true
oGrid.ContinueColumnScroll = false
rs = CREATE OLEObject
rs.ConnectToNewObject("ADOR.Recordset")
	rs.Open("Orders","Provider=Microsoft.ACE.OLEDB.12.0;Data Source=C:\Program Files\Exontrol\ExGrid\Sample\Access\misc.accdb",3,3)
oGrid.DataSource = rs
oGrid.ReadOnly = -1
|
|
909
|
Also, are there any plans on the ability to put borders on individual cells or rows or columns
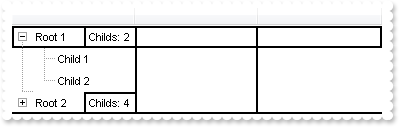
OleObject oGrid,var_Appearance,var_Items
any h,hx

oGrid = ole_1.Object
oGrid.BeginUpdate()
var_Appearance = oGrid.VisualAppearance
	var_Appearance.Add(1,"gBFLBCJwBAEHhEJAAChABOUGACAADACAxRDQNABQKAAzQFAYbBkGqGAAGIYxYgmFgAQhFcZQSpEEg7BKMYwjOJgFgmEQxDANIBQSKoaQiGQYRhkEYgEiONoaDJCM4wHIMQxHCKTZRkGYpajOPobUbGUywHRcRRvH6EZQGWg6GjqK43SCEEZhJBNGyTJ6BZbGURbCqSLAwWZAYy2RCMRxDJqLKypSwKPoGKosS5OUwzHItaRtHaJJAwKZ6ApGQpRVTAYxVfC1PzkACma4nS7oXraVJFVZTdYwTh+JABTzGLpnKw7FhGa5pABpdq0RTuOZdAbPMoyXBrXqqB46UCOGg5HRWWwHR7ZIquap9JzfCq5cRbWr5BBOPaBYKwdD1CB+iMVRnlQRY4hafZwAMH5Pl4XQnjCEBECSIBpDGHQOicIwtBIBpmiWEIJj6eJQloEgomafgyGGCI6kKYZQH+igGAKAJgEgFgGgGYIFlCf4CmCSA2A6A5hAgRgEgQYRIFYFIEmEaBmBmBghigdgQgcIZogYC4ICIKB6CSCRhiiHgogWIooi4F4AmKaIaDCDBihiTg0gsIIYmYOoOmOSJ2D6AZQBAgI=")
	var_Appearance.Add(2,"gBFLBCJwBAEHhEJAAChABdUIQAAYAQGKIaBoAKBQAGaAoDDYMg1QwAAxDGLEEwsACEIrjKCVIgkHYJRjGEZxNCMIhiGAaQChEZYHgkMomDAOEgyHKcEgJGyEQgkOa4ajCKYrSzAcrwTI4cRVHiQZygOZ4DBSOY8VBAcQweItJhrKqVRgriitNQjCyjZCpOaIDooAJmRZNNISBBIEQSKA0TDOQ5TSKUMYhOZTBBEbbMNBtBIUIRpajbMBiFywUxUOJYXhmG4dR7IMhyLI8UxXFo7P7mOZZXjmO49T7Kc70LQ9CyHJKnabpWoaXj2VZZV7Mda2DTNSzPKK1bZpG4bTouKZ5WjfN72fgeCzrF7HchyPJcXxnG4ZAMBA")
	var_Appearance.Add(3,"gBFLBCJwBAEHhEJAAChABL0GACAADACAxRDQNABQKAAzQFAYbBkGqGAAGIYxYgmFgAQhFcZQSpEEg7BKMYwjOJgEgmEQxDANIBQSKoaQiGQYRhkEYpFiONoXDJCM4wHIMQxHCKTZRkGYpajOPobUbGUygBRdExvEyEZQGWg6GjqK43SCEEZhJBNGyfH6dBpEWT7ChENQwWLLFoRDIcQyXCytIDter4boGKosS5OUwzGAtaRvHaJJAwKZ6ApGQpRVTAYxUdC1HTjJiEa4nS7oXraVJFVZTdYwTh+JABTzGKbsSycKqWaqkABZeoWbTuOZdAbPMoyXBrXgOLYzUCOGg5HRWWwHR7ZIq0Pg9Hqaa4bVbIVxbcAGH6BQa6J5hEBECSIBpDGHQOicIwtBIBpmhqEIJj2eJQloEgokiegyGGCI6kKZ5BnefA+D8L4flOa52nufg+g+f5fnPFB/ooBZ1omSAWASAJgGgJgJgIIIoDYAIDCCaBFnuBAhCgOgUgUYIoF4GIBiGKBuAcfohmgNgdggX54g4JB/F+GImCqCpikiNguguUAQICA=")
	var_Appearance.Add(4,"gBFLBCJwBAEHhEJAAChABBUGACAADACAxRDQNABQKAAzQFAYbBkGqGAAGIYxYgmFgAQhFcZQSpEEg7BKMYwjOJgCgmEQxDANMiwGKoaQiGQYRhkEYgFiONoaDJCM4wHIMQxHCKTZRkGYpajOPobUbAYQQSAkEgpECbZqoEZaDoaOorTZINJ0VR1Ox5KKfZyGURZPqOEQ1DBZEI2RZUbxDJquLhACj7AjeZZtRJZVp2TY9eQ3LC3aYhGqwAwSFpJVjUEBgRBJIDSMY6DpOIxaEgNZpwEITOTxUK0EhRLy5agDCJ1QrCdanahqOpaXpmW5dV7YNh2LTnfzXNq3bhuO5bXqOd59X7fN54Dg+D4LRLHbpxXIcXqvFaZZDnOb4ToPEuAZUmqcB2B2DoHGuN5Tm6d46lsPwfhOS5mnOeg9DqCAIICA")
oGrid.LinesAtRoot = 1
oGrid.SelBackColor = oGrid.BackColor
oGrid.SelForeColor = oGrid.ForeColor
oGrid.DefaultItemHeight = 22
oGrid.Columns.Add("")
oGrid.Columns.Add("").Def(4,33554432)
oGrid.Columns.Add("")
var_Items = oGrid.Items
	h = var_Items.AddItem("Root 1")
	var_Items.ItemBackColor(h,16777216 /*0x1000000*/)
	hx = var_Items.SplitCell(h,0)
	var_Items.CellValue(0,hx,"count(current,dir,1)")
	var_Items.CellValueFormat(0,hx,4)
	var_Items.FormatCell(0,hx,"'Childs: ' + value")
	var_Items.CellBackColor(0,hx,50331648 /*0x3000000*/)
	var_Items.CellHAlignment(0,hx,1)
	var_Items.InsertItem(h,,"Child 1")
	var_Items.InsertItem(h,,"Child 2")
	var_Items.ExpandItem(h,true)
	h = var_Items.AddItem("Root 2")
	var_Items.ItemBackColor(h,67108864 /*0x4000000*/)
	hx = var_Items.SplitCell(h,0)
	var_Items.CellValue(0,hx,"count(current,dir,1)")
	var_Items.CellValueFormat(0,hx,4)
	var_Items.FormatCell(0,hx,"'Childs: ' + value")
	var_Items.CellBackColor(0,hx,50331648 /*0x3000000*/)
	var_Items.CellHAlignment(0,hx,1)
	var_Items.InsertItem(h,,"Child 1")
	var_Items.InsertItem(h,,"Child 2")
	var_Items.InsertItem(h,,"Child 3")
	var_Items.ItemBackColor(var_Items.InsertItem(h,,"Child 4"),67108864 /*0x4000000*/)
oGrid.EndUpdate()
|
|
908
|
How can I decode the Layout property
OleObject oGrid,var_Columns,var_Items,var_Print

oGrid = ole_1.Object
oGrid.BeginUpdate()
var_Columns = oGrid.Columns
	var_Columns.Add("C1")
	var_Columns.Add("C2").Position = 1
var_Items = oGrid.Items
	var_Items.CellValue(var_Items.AddItem("SubItem 1.1"),1,"SubItem 1.2")
	var_Items.CellValue(var_Items.AddItem("SubItem 2.1"),1,"SubItem 2.2")
oGrid.Columns.Item("C2").SortOrder = 2
oGrid.EndUpdate()
MessageBox("Information",string( "Encoded:" ))
MessageBox("Information",string( oGrid.Layout ))
var_Print = CREATE OLEObject
var_Print.ConnectToNewObject("Exontrol.Print")
	MessageBox("Information",string( "Decoded: " ))
	MessageBox("Information",string( var_Print.Decode64TextW(oGrid.Layout) ))
|
|
907
|
No new line is shown if using <br> tag. How can I show a new line with-in the cell
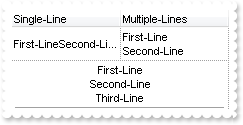
OleObject oGrid,var_Column,var_Column1,var_Items
any h

oGrid = ole_1.Object
oGrid.BeginUpdate()
oGrid.ScrollBySingleLine = true
oGrid.DrawGridLines = -2
var_Column = oGrid.Columns.Add("Single-Line")
	var_Column.Def(16,true)
	var_Column.Def(17,1)
var_Column1 = oGrid.Columns.Add("Multiple-Lines")
	var_Column1.Def(16,false)
	var_Column1.Def(17,1)
var_Items = oGrid.Items
	var_Items.CellValue(var_Items.AddItem("First-Line<br>Second-Line"),1,"First-Line<br>Second-Line")
	h = var_Items.AddItem("First-Line<br>Second-Line<br>Third-Line")
	var_Items.CellSingleLine(h,false)
	var_Items.CellHAlignment(h,0,1)
	var_Items.ItemDivider(h,0)
oGrid.EndUpdate()
|
|
906
|
I am using exCRD to layout the columns in the grid, but is there a way where I can have the text in a cell wrap if it's exceeds the width of the cell instead of showing the ...'s
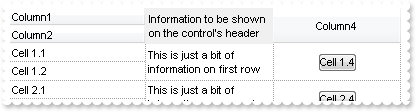
OleObject oGrid,var_Column,var_Column1,var_Column2,var_Column3,var_Column4,var_Columns,var_Items
any h

oGrid = ole_1.Object
oGrid.BeginUpdate()
oGrid.DrawGridLines = -2
oGrid.DefaultItemHeight = 36
oGrid.FullRowSelect = 0
var_Columns = oGrid.Columns
	var_Column = var_Columns.Add("Column1")
		var_Column.Visible = false
		var_Column.Editor.EditType = 1
	var_Column1 = var_Columns.Add("Column2")
		var_Column1.Visible = false
		var_Column1.Editor.EditType = 1
	var_Column2 = var_Columns.Add("Column3")
		var_Column2.Visible = false
		var_Column2.Def(16,false)
		var_Column2.Editor.EditType = 1
	var_Column3 = var_Columns.Add("Column4")
		var_Column3.Alignment = 1
		var_Column3.HeaderAlignment = 1
		var_Column3.Visible = false
		var_Column3.Def(2,true)
		var_Column3.Def(3,true)
	var_Column4 = var_Columns.Add("FormatLevel")
		var_Column4.FormatLevel = "(0/1)," + CHAR(34) + "Information to be shown on the control's header" + CHAR(34) + "[a=17][ww]:128,3:128"
		var_Column4.Def(32,"(0/1),2[a=17][ww]:128,3:128")
var_Items = oGrid.Items
	h = var_Items.AddItem("Cell 1.1")
	var_Items.CellValue(h,1,"Cell 1.2")
	var_Items.CellValue(h,2,"This is just a bit of information on first row")
	var_Items.CellValue(h,3,"Cell 1.4")
	var_Items.CellSingleLine(h,3,false)
	h = var_Items.AddItem("Cell 2.1")
	var_Items.CellValue(h,1,"Cell 2.2")
	var_Items.CellValue(h,2,"This is just a bit of information on second row")
	var_Items.CellValue(h,3,"Cell 2.4")
oGrid.EndUpdate()
|
|
905
|
How can I load pictures using URL ( http:// )
OleObject http,oGrid

oGrid = ole_1.Object
http = CREATE OLEObject
http.ConnectToNewObject("Exontrol.HTTP")
oGrid.PictureDisplay = 34
oGrid.Picture = http.GETImage("http://mail.exontrol.com/images/exontrol.png")
|
|
904
|
How can I filter programmatically by multiple columns
OleObject oGrid,var_Column,var_Column1,var_Column2,var_Column3,var_Columns,var_Items
any h

oGrid = ole_1.Object
oGrid.BeginUpdate()
var_Columns = oGrid.Columns
	var_Columns.Add("Name")
	var_Column = var_Columns.Add("Active")
		var_Column.Def(0,true)
		var_Column.DisplayFilterButton = true
	var_Columns.Add("Type")
	var_Columns.Add("Mode").FilterType = 240
var_Items = oGrid.Items
	h = var_Items.AddItem("Item A")
	var_Items.CellState(h,1,1)
	var_Items.CellValue(h,2,"A")
	h = var_Items.AddItem("Item B")
	var_Items.CellState(h,1,0)
	var_Items.CellValue(h,2,"B")
	h = var_Items.AddItem("Item C")
	var_Items.CellState(h,1,1)
	var_Items.CellValue(h,2,"C")
	var_Items.CellValue(h,3,"None")
	h = var_Items.AddItem("Item D")
	var_Items.CellState(h,1,1)
	var_Items.CellValue(h,2,"C")
var_Column1 = oGrid.Columns.Item(1)
	var_Column1.FilterType = 6
	var_Column1.Filter = String(1)
var_Column2 = oGrid.Columns.Item(2)
	var_Column2.FilterType = 240
	var_Column2.Filter = "C"
var_Column3 = oGrid.Columns.Item(3)
	var_Column3.FilterType = 2
oGrid.ApplyFilter()
oGrid.EndUpdate()
|
|
903
|
How can I add Right-To-Left Reading-Order / RTL Layout
OleObject oGrid,var_Column,var_Items

oGrid = ole_1.Object
oGrid.BeginUpdate()
oGrid.TreeColumnIndex = -1
var_Column = oGrid.Columns.Add("RTL - Header Caption")
	var_Column.HeaderAlignment = 131074 /*0x20000 | RightAlignment*/
	var_Column.Alignment = 131074 /*0x20000 | RightAlignment*/
oGrid.FullRowSelect = 0
var_Items = oGrid.Items
	var_Items.AddItem("RTL - Text Right")
	var_Items.CellHAlignment(var_Items.AddItem("RTL - Text Center"),0,131073 /*0x20000 | CenterAlignment*/)
	var_Items.CellHAlignment(var_Items.AddItem("RTL - Text Left"),0,131072 /*0x20000 | */)
oGrid.EndUpdate()
|
|
902
|
I have applied ebn to the grid using the following code, and noticed that it applies to the filter dropdownList too. Is there a way to prevent this behavior, like keeping the Filter dropdownlist intact
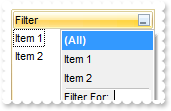
OleObject oGrid,var_Items

oGrid = ole_1.Object
oGrid.VisualAppearance.Add(1,"c:\exontrol\images\normal.ebn")
oGrid.Appearance = 16777216 /*0x1000000 | */
oGrid.BackColorHeader = 16777216 /*0x1000000*/
oGrid.Background(26,-2147483633 /*0x8000000f*/)
oGrid.Columns.Add("Filter").DisplayFilterButton = true
var_Items = oGrid.Items
	var_Items.AddItem("Item 1")
	var_Items.AddItem("Item 2")
|
|
901
|
The tree lines from the group parent to its children are missing and no identation is present: the parent and all its children are on the same offset from left. What canbe done
/*begin event AddGroupItem(long  Item) - Occurs after a new Group Item has been inserted to Items collection.*/
/*
	OleObject var_Items
	any nGroupColumn
	oGrid = ole_1.Object
	var_Items = oGrid.Items
		nGroupColumn = var_Items.GroupItem(Item)
		var_Items.ItemDivider(Item,-1)
		var_Items.FormatCell(Item,0,var_Items.FormatCell(Item,nGroupColumn))
		var_Items.CellValue(Item,0,oGrid.Columns.Item(nGroupColumn).GroupByTotalField)
		var_Items.CellValueFormat(Item,0,var_Items.CellValueFormat(Item,nGroupColumn))
*/
/*end event AddGroupItem*/

OleObject oGrid,rs,var_Column

oGrid = ole_1.Object
oGrid.BeginUpdate()
oGrid.ReadOnly = -1
oGrid.ColumnAutoResize = false
rs = CREATE OLEObject
rs.ConnectToNewObject("ADOR.Recordset")
	rs.Open("Orders","Provider=Microsoft.ACE.OLEDB.12.0;Data Source=C:\Program Files\Exontrol\ExGrid\Sample\Access\misc.accdb",3,3)
oGrid.DataSource = rs
oGrid.SortBarVisible = true
oGrid.SortBarCaption = "Drag a <b>column</b> header here to group by that column."
oGrid.AllowGroupBy = true
var_Column = oGrid.Columns.Item(0)
	var_Column.AllowGroupBy = false
	var_Column.Width = 96
oGrid.Columns.Item(1).SortOrder = 1
oGrid.LinesAtRoot = -1
oGrid.EndUpdate()
|